Cable (GBP/USD) has been clawing its way back toward the top of a multi-month descending channel pattern!
Will sellers step back in to defend the downtrend? Or will we see an upside breakout this week?
Here’s what we’re watching on the 4-hour chart:
GBP/USD: 4-hour
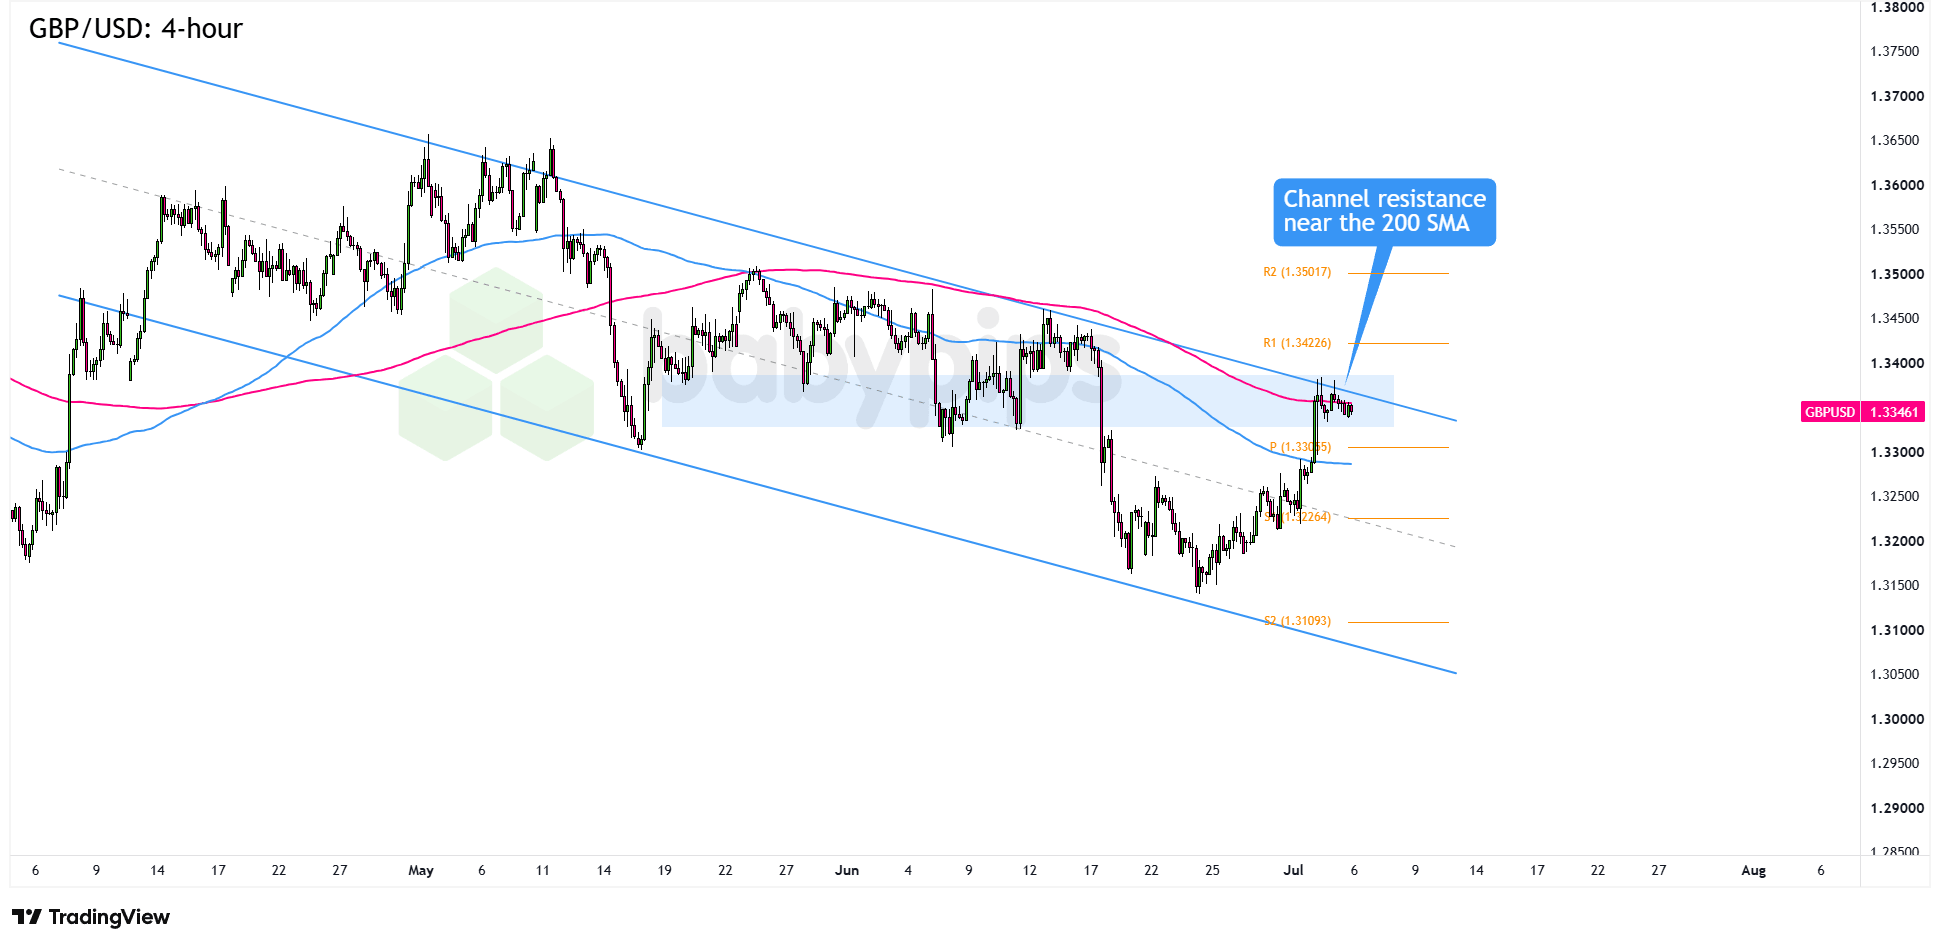
GBP/USD 4-hour Forex Chart Faster with TradingView
It’s shaping up to be a busy week for the pound, though some of the drama may already be baked in after last week’s U.S. jobs miss and Fed Chair Warsh’s dovish turn at Sintra sent Greenback bulls running for cover and helped GBP/USD climb back toward channel resistance.
Monday’s U.K. construction PMI could test that bounce, especially after May’s reading sank to 38.2, its weakest print since 2020. On Tuesday, the Bank of England also releases its Financial Stability Report and Governor Andrew Bailey takes the mic, with traders likely watching for more warnings about leverage in bond and equity markets after his cautious Sintra remarks.
GBP/USD, which bounced off the bottom of its descending channel back in late June, has now worked its way up to the top of that same channel, and it’s arriving right into a pileup of technical resistance.Remember that directional biases and volatility conditions in market price are typically driven by fundamentals. If you haven’t yet done your homework on the British pound and the U.S. dollar, then it’s time to check out the economic calendar and stay updated on daily fundamental news!
The Pivot Point’s R1 at 1.3423 is right above the 200 SMA and the upper channel resistance, and it’s also not far from the 50% Fibonacci retracement of the May to June selloff.
The hesitation candlesticks up in here suggest buyers are running out of steam.
If GBP/USD starts poppin’ up more bullish candlesticks and manages a sustained break above the channel and 200 SMA, that could open the door to R2 at 1.3502, which lines up with the 61.8% retracement near 1.3487 and would go a long way toward invalidating the broader downtrend.
On the flip side, continued rejection here and a slide back below channel resistance could send GBP/USD back toward the Pivot Point at 1.3307, with S1 at 1.3226 and previous 1.3150 lows as the next stops if sellers regain full control.
This GBP/USD analysis leans on multiple overlapping technical signals to size up a key resistance zone, and if you’re not familiar with how traders use confluence to evaluate those setups, Premium members can read our lesson:
📖 Confluence: Stacking the Odds in Your Favor
Reading this helps you understand how to score a price action setup using confluence, why multiple factors converging at the same level matter more than any single signal in isolation, and how to apply that framework when sizing up a potential breakout or rejection.
And if you’re not a Premium subscriber yet, now’s a good time to sign up.
With Babypips Premium, you get full access to School of Pipsology lessons that help you understand not just where technical signals are converging on the chart, but how to systematically score that confluence before deciding whether a setup is worth trading.