


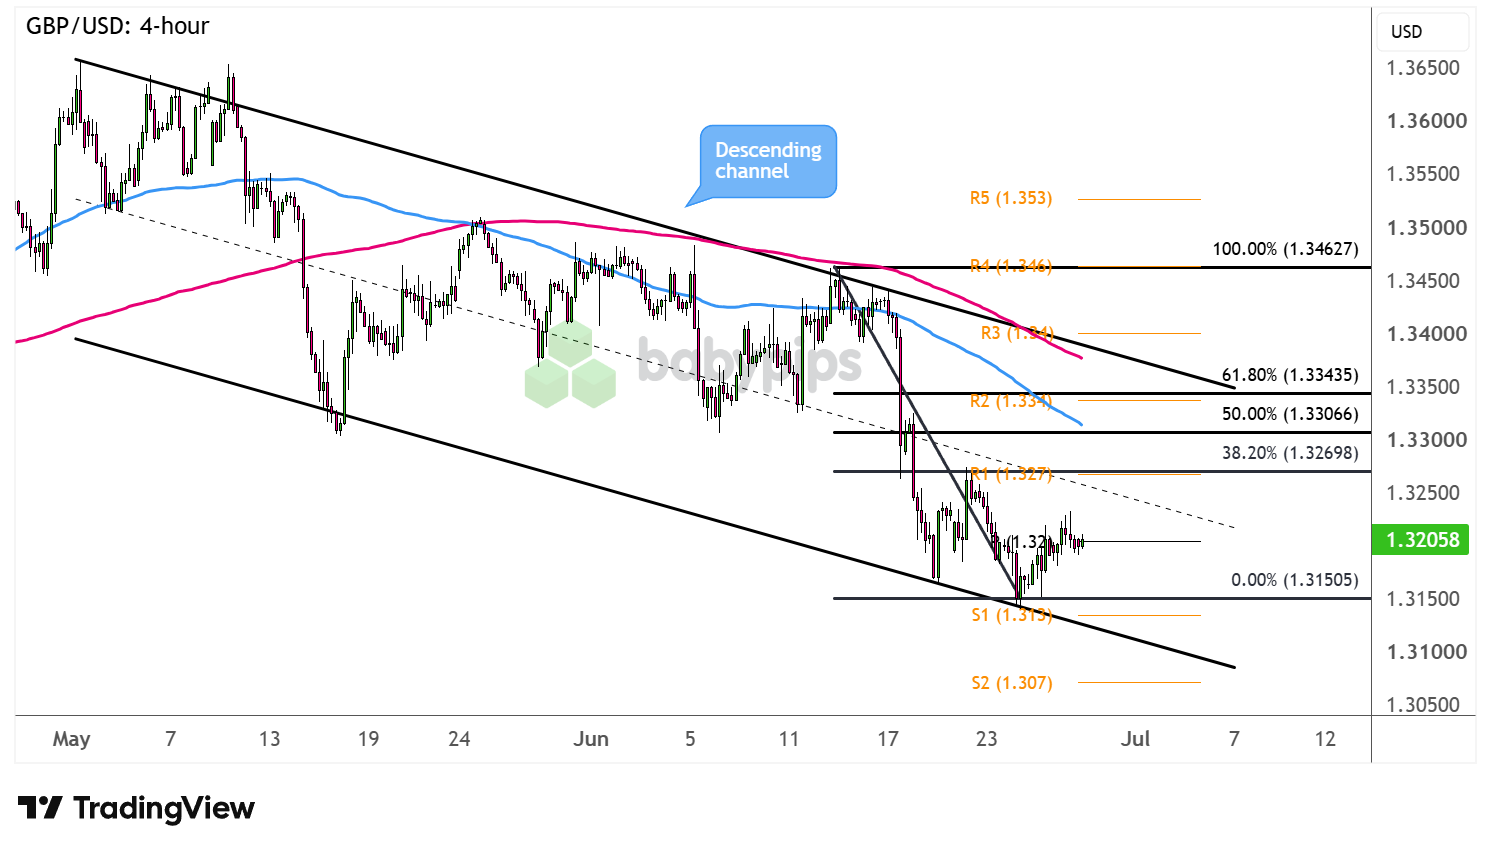
GBP/USD has been cruising inside a descending channel with its lower highs and lower lows.
Can it pull off another retracement to the channel top?
Check out these Fibonacci levels on the 4-hour time frame!
GBP/USD: 4-hour
GBP/USD 4-hour Forex Chart Faster with TradingView
Dollar domination has been in play these days, thanks mostly to safe-haven flows from resurfacing geopolitical tensions and hawkish Fed expectations.
Meanwhile, the British pound has been acting as a “risk currency” while also edging lower on Bank of England (BOE) tightening doubts.
Can Cable head further south from here?
The pair is hovering just above its descending channel bottom, possibly considering a break below support that could set off a steeper slide to the next bearish target at S2 (1.3070) or lower.Remember that directional biases and volatility conditions in market price are typically driven by fundamentals. If you haven’t yet done your homework on the British pound and the U.S. dollar, then it’s time to check out the economic calendar and stay updated on daily fundamental news!
A bounce, on the other hand, could pave the way for a correction to the Fibonacci levels. The 38.2% Fib lines up neatly with R1 (1.3270), while the 50% level is closer to the 1.3300 major psychological resistance.
The line in the sand for a pullback could be the 61.8% Fib near the channel top and R2 (1.3340) since this also coincides with a former support zone that could now hold as a ceiling.
Keep your eyes peeled for reversal candlesticks at these levels, as a continuation of the downtrend could drag Cable back to the swing lows near the pivot point (1.3200) or to the channel support at S1 (1.3130).
This article references Fibonacci levels and channel support to assess whether GBP/USD is setting up for a retracement or a deeper breakdown, and the distinction between those two outcomes is not always obvious. Premium members can read our lesson:
📖 How to Identify Reversals and Retracements
Reading this helps you understand how to use Fibonacci levels to distinguish a retracement from a true reversal, how pivot points and trendlines add confluence to those readings, and how to avoid acting on a pullback that is actually the start of a new leg down.
And if you’re not a Premium subscriber yet, now’s a good time to sign up.
With Babypips Premium, you get full access to School of Pipsology lessons that help you understand not just what the Fibonacci levels are showing, but how to read whether price is likely to reverse or continue so you can trade with more confidence at key chart levels.


