





GBP/NZD has formed lower highs and lower lows connected by a freshly forming descending channel.
Is the ceiling still about to hold on this test?
Check out these inflection points on the 4-hour chart!
GBP/NZD: 4-hour
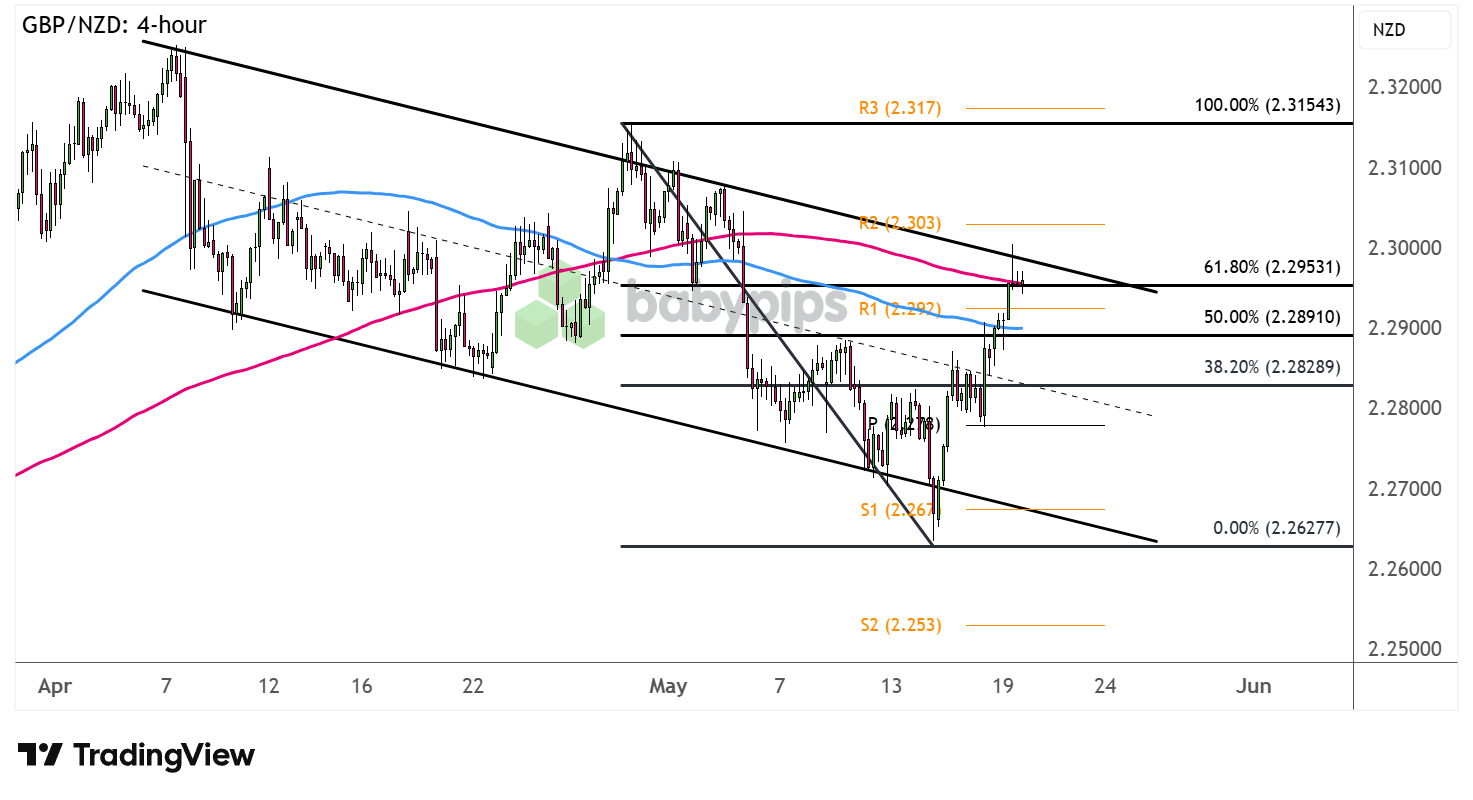
GBP/NZD 4-hour Forex Chart Faster With TradingView
Political uncertainty in the U.K. stemming from challenges to Prime Minister Starmer’s leadership has weighed on Sterling for the most part of May, keeping GBP/NZD in a steady decline.
However, returning risk-off flows from escalating Middle East tensions on the breakdown of US-Iran peace proposal negotiations have also weighed on the higher-yielding Kiwi recently.
Is the downtrend still our friend on this pair?
GBP/NZD is currently testing the descending channel resistance, which is right in line with the 61.8% Fibonacci retracement level, 200 SMA dynamic inflection point, and R1 (2.2920).Remember that directional biases and volatility conditions in market price are typically driven by fundamentals. If you haven’t yet done your homework on the British pound and the New Zealand dollar, then it’s time to check out the economic calendar and stay updated on daily fundamental news!
A reversal candle has also formed, and the next candlesticks closing below its lows could confirm that bears are refusing to let up. In that case, look out for a continuation of the selloff back to the nearby bearish targets, possibly around the mid-channel area of interest at 2.2800 or all the way down to support around S1 (2.2670).
On the other hand, continued upside pressure triggering a break above the channel top could set off a bullish reversal to the next resistance zones at R2 (2.2303), then R3 (2.3170).
Whichever bias you end up trading, don’t forget to practice proper risk management and stay aware of top-tier catalysts that could influence overall market sentiment.
Disclaimer:
Please be aware that the technical analysis content provided herein is for informational and educational purposes only. It should not be construed as trading advice or a suggestion of any specific directional bias. Technical analysis is just one aspect of a comprehensive trading strategy. The technical setups discussed are intended to highlight potential areas of interest that other traders may be observing. Ultimately, all trading decisions, risk management strategies, and their resulting outcomes are the sole responsibility of each individual trader. Please trade responsibly.
This CAD/JPY analysis leans on market structure concepts like higher highs, higher lows, and ascending channel support that not all traders are familiar with. Premium members can read our lesson:
📖 Market Structure: Trends and Ranges
Reading this helps you understand how to identify who’s winning between buyers and sellers, how the sequence of highs and lows defines a trend, and how to read the framework underlying a chart setup like this one.
And if you’re not a Premium subscriber yet, now’s a good time to sign up.
With Babypips Premium, you get full access to School of Pipsology lessons that help you understand not just what the chart is showing, but the market structure principles that explain why the levels and trend direction in setups like this one actually matter.



