


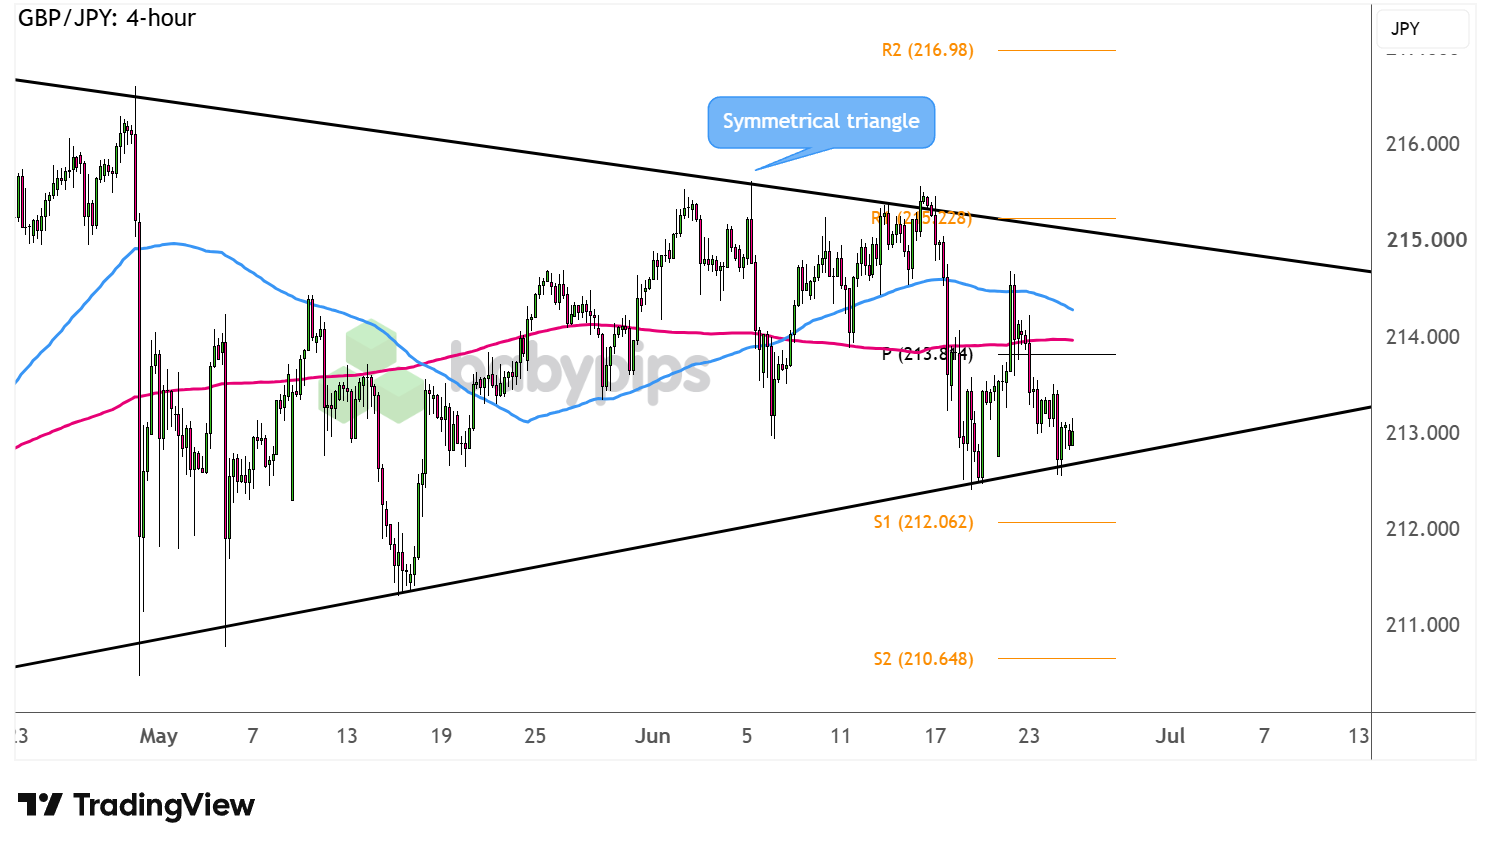
GBP/JPY has formed higher lows and lower highs to consolidate inside a symmetrical triangle.
Now that it’s testing support, will we see a breakout next?
Check out these inflection points on the 4-hour time frame!
GBP/JPY: 4-hour
GBP/JPY 4-hour Forex Chart Faster with TradingView
Shifting risk sentiment on geopolitical headlines, U.K. political uncertainty, and yen intervention threats have all kept Guppy tossing and turning inside a holding pattern since May.
Add to that a resurgence in AI-related tech valuation concerns, and we’ve got the pair teetering right above the triangle support around the 213.00 major psychological level this week.
Can it break lower from here?
Pound bears appear to be pressing on the floor, possibly eyeing a breakdown that could take GBP/JPY down to the next bearish targets at S1 (212.06) then S2 (210.65) or perhaps a selloff that’s the same height as the chart formation.Remember that directional biases and volatility conditions in market price are typically driven by fundamentals. If you haven’t yet done your homework on the British pound and the Japanese yen, then it’s time to check out the economic calendar and stay updated on daily fundamental news!
Should support still hold, on the other hand, the pair could set its sights back to near-term resistance zones. The Pivot Point (213.81) is right around the dynamic inflection points at the moving averages, while the triangle resistance is near R1 (215.23).
Just be sure to stay on the lookout for reversal candlesticks suggesting a potential bounce or long red candles pointing to a likely break lower to gauge which direction Guppy may be headed next.
Whichever bias you end up trading, don’t forget to practice proper risk management and stay aware of top-tier catalysts that could influence overall market sentiment!
GBP/JPY is testing triangle support, and the next move could be a clean breakout or a fakeout trap. Premium members can read our lesson:
📖 Trading Fakeouts: When the Trap Becomes the Trade
Reading this helps you understand how to recognize a fakeout while it’s forming, how to trade in the opposite direction with a rules-based framework, and how to avoid getting trapped when price briefly breaks a key level and snaps back.
And if you’re not a Premium subscriber yet, now’s a good time to sign up.
With Babypips Premium, you get full access to School of Pipsology lessons that help you understand not just where price is sitting on a chart, but how to read the move before it happens and trade it with a clear plan.


