





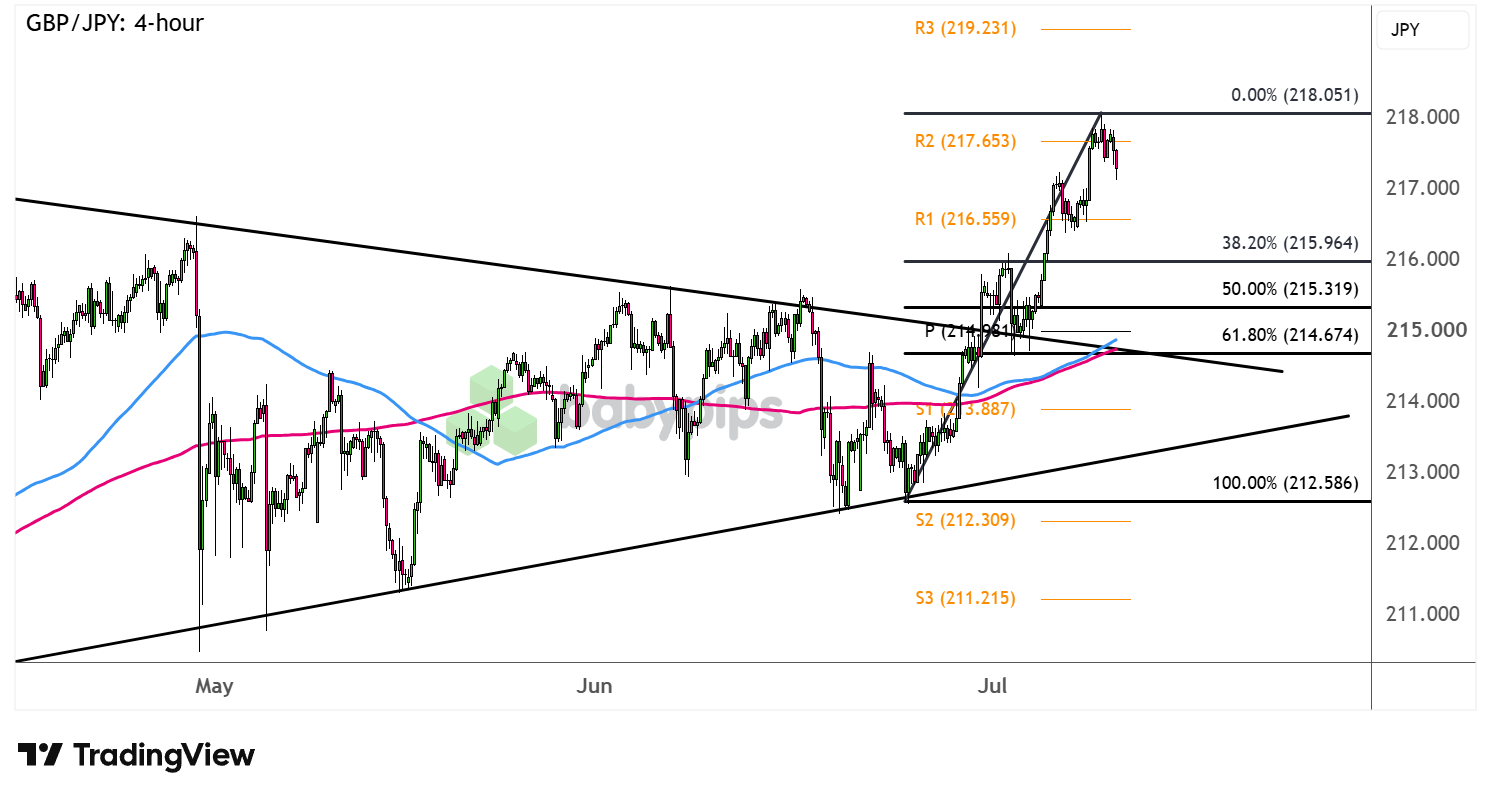
Guppy recently busted through its symmetrical triangle resistance but seems to be stalling on its climb.
Is it gearing up for a quick retest?
Check out these Fibonacci retracement levels where buyers may be waiting!
GBP/JPY: 4-hour
GBP/JPY 4-hour Forex Chart Faster with TradingView
Markets seem to be shrugging off headlines on geopolitical conflict these days, as the AI-related tech rally in equities has been propping up risk assets while weighing on the safe-haven yen.
At the same time, the lack of actual intervention measures by Japanese officials seems to have cleared the way for further yen weakness.
Can GBP/JPY sustain its breakout rally from here?
GBP/JPY is testing the ceiling at R2 (217.65) and could use a correction to nearby support levels to attract more bullish momentum.Remember that directional biases and volatility conditions in market price are typically driven by fundamentals. If you haven’t yet done your fundie homework on the British pound and the Japanese yen, then it’s time to check out the economic calendar and stay updated on daily fundamental news!
The Fibonacci retracement tool shows that the 38.2% level is near the 216.00 major psychological support while the 50% Fib is closer to the pivot point (214.98) and the broken triangle top. Meanwhile, the 61.8% level coincides with the dynamic inflection points at the moving averages.
Keep your eyes peeled for reversal candlesticks at any of these levels, as a bounce could take the pair right back up to the swing high or to fresh upside targets around R3 (219.23).
Whichever bias you end up trading, don’t forget to practice proper risk management and stay aware of top-tier catalysts that could influence overall market sentiment!
This GBP/JPY setup leans on Fibonacci retracement levels and pivot points to map out where a pullback might find support after a breakout, tools that may be unfamiliar if you haven’t studied retracement analysis before. Premium members can read our lesson:
📖 How to Identify Reversals and Retracements
Reading this helps you understand how Fibonacci levels and pivot points are used together, why these tools help distinguish a healthy pullback from a deeper reversal, and how to read potential support zones like the ones marked on this GBP/JPY chart.
And if you’re not a Premium subscriber yet, now’s a good time to sign up.
With Babypips Premium, you get full access to School of Pipsology lessons that help you understand not just where price is sitting on the chart, but why traders use tools like Fibonacci retracements and pivot points to anticipate where a breakout might pause or reverse.



