





GBP/JPY looks ready to bounce from a major support zone!
Think pound bulls and yen bears can defend the area for another day?
Here’s what we’re seeing on GBP/JPY’s 4-hour chart!
GBP/JPY: 4-hour
GBP/JPY 4-hour Forex Chart Faster with TradingView
The British pound has been the worst-performing major currency this week, weighed down by growing political uncertainty after Health Secretary Wes Streeting’s resignation fueled speculation over a possible leadership challenge to Prime Minister Starmer.
The Japanese yen hasn’t done much better, with USD/JPY reclaiming the 158 handle as the intervention-driven rally continues to fade. Still, BOJ warnings that further yen weakness could lift inflation expectations keep downside risks on the table. With the broader backdrop still risk on, safe haven demand for the yen may stay capped.
If the U.K. political noise fades instead of turning into a formal confidence vote, Sterling’s resilient growth story could come back into focus and give GBP/JPY the catalyst it needs to bounce and extend its multi-week uptrend.
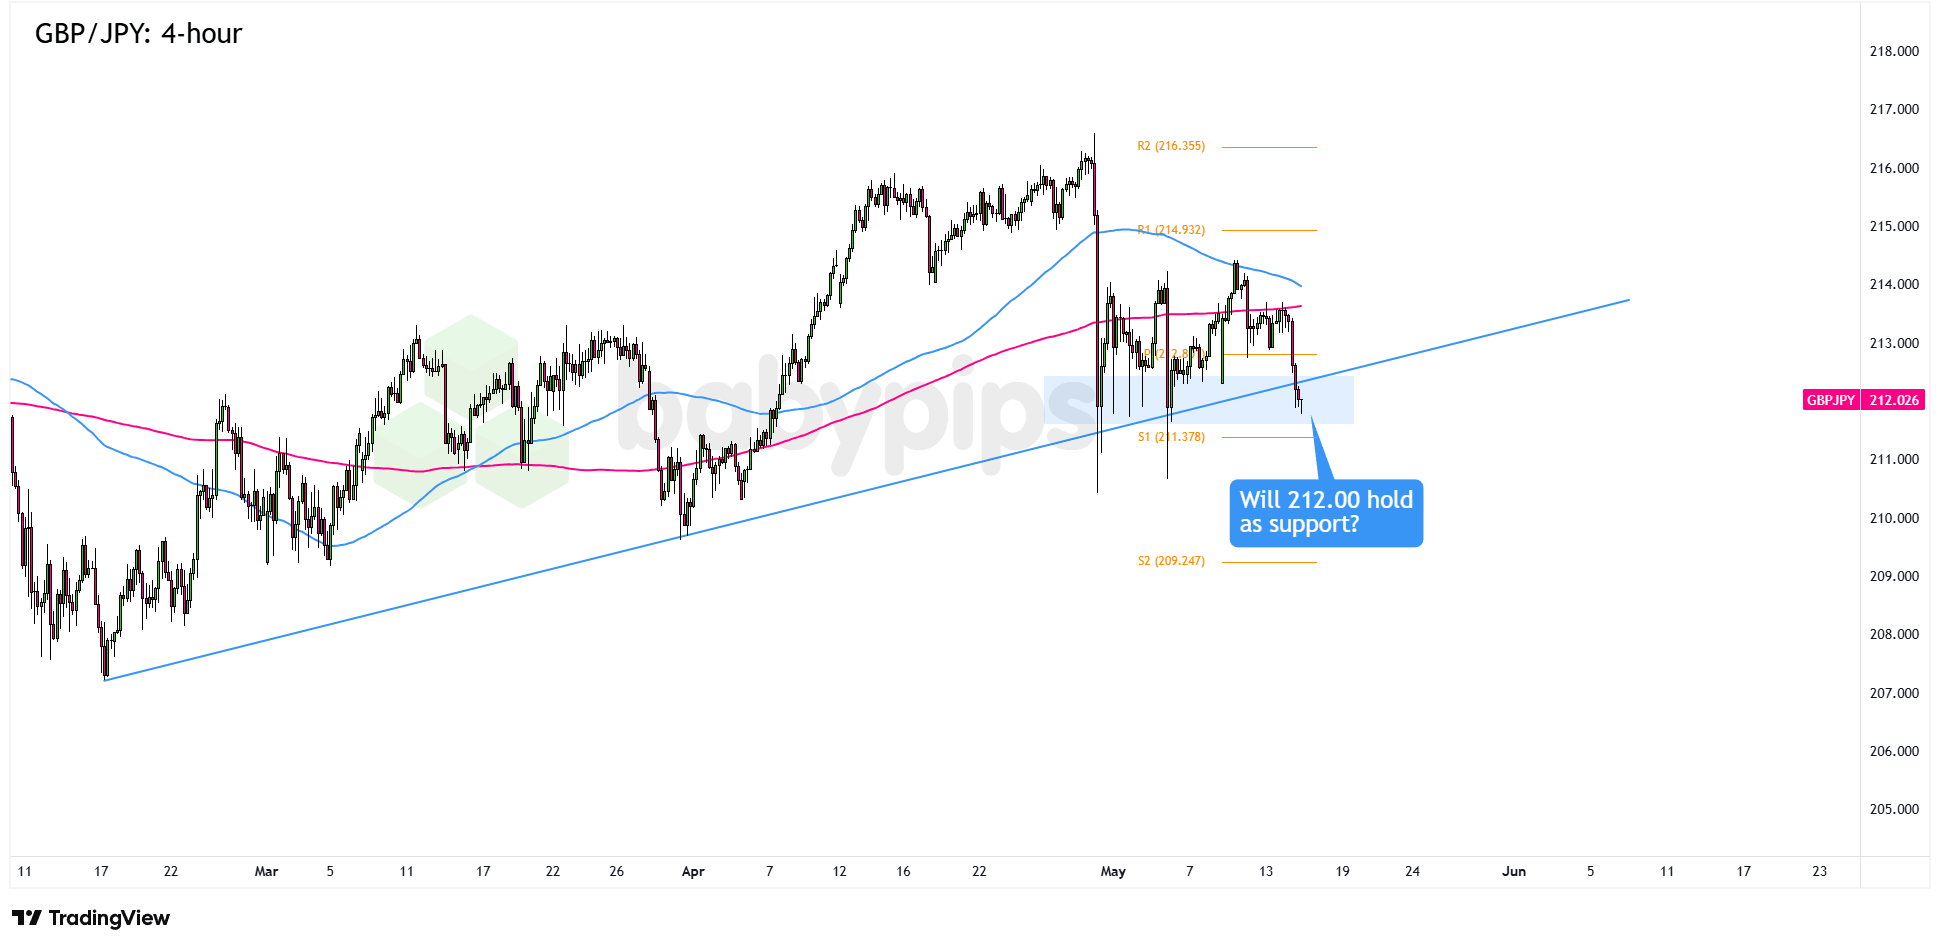
GBP/JPY has been making higher highs and higher lows since mid-February, when the pair bounced from the 207.00 psychological handle.Remember that directional biases and volatility conditions in market price are typically driven by fundamentals. If you haven’t yet done your homework on the British pound and the Japanese yen, then it’s time to check out the economic calendar and stay updated on daily fundamental news!
The upswing, however, ran into a ceiling around the 216.00 zone and has since pulled back to the 212.00 area.
So far, buyers have managed to defend the 212.00 psychological level despite yentervention threats, likely helped by trend line support and the S1 Pivot Point at 211.38 hanging around the same area.
The long wicks around support suggest buyers are still showing up, and a stronger bounce could take GBP/JPY back to nearby areas of interest like the 213.00 handle or the previous consolidation zone around 214.00.
But if the current downswing leads to sustained trading below 211.00, then the pair could slide toward bigger inflection points like the 210.00 psychological zone or the S2 Pivot Point at 209.25.
Whichever bias you end up trading, don’t forget to practice proper risk management and stay aware of top-tier catalysts that could influence overall market sentiment.
Disclaimer:
Please be aware that the technical analysis content provided herein is for informational and educational purposes only. It should not be construed as trading advice or a suggestion of any specific directional bias. Technical analysis is just one aspect of a comprehensive trading strategy. The technical setups discussed are intended to highlight potential areas of interest that other traders may be observing. Ultimately, all trading decisions, risk management strategies, and their resulting outcomes are the sole responsibility of each individual trader. Please trade responsibly.
This GBP/JPY setup is built around reading higher highs and higher lows, identifying support zones, and knowing where the trend stands before looking for an entry. If the framework behind that kind of analysis isn’t fully familiar yet, Premium members can read our lesson:
📖 Market Structure: Trends and Ranges
Reading this helps you understand how to read the sequence of highs and lows that defines a trend, how to tell who is winning between buyers and sellers at any given moment, and how to identify what kind of market you are in before you look for a single trade.
And if you’re not a Premium subscriber yet, now’s a good time to sign up.
With Babypips Premium, you get full access to School of Pipsology lessons that help you understand not just what the chart is showing, but the market structure concepts behind why price reacts the way it does at key levels.



