


Trend traders huddle up!
GBP/CAD looks ready to form another higher low after its sharp drop earlier this week.
Think the pair can extend its longer-term uptrend?
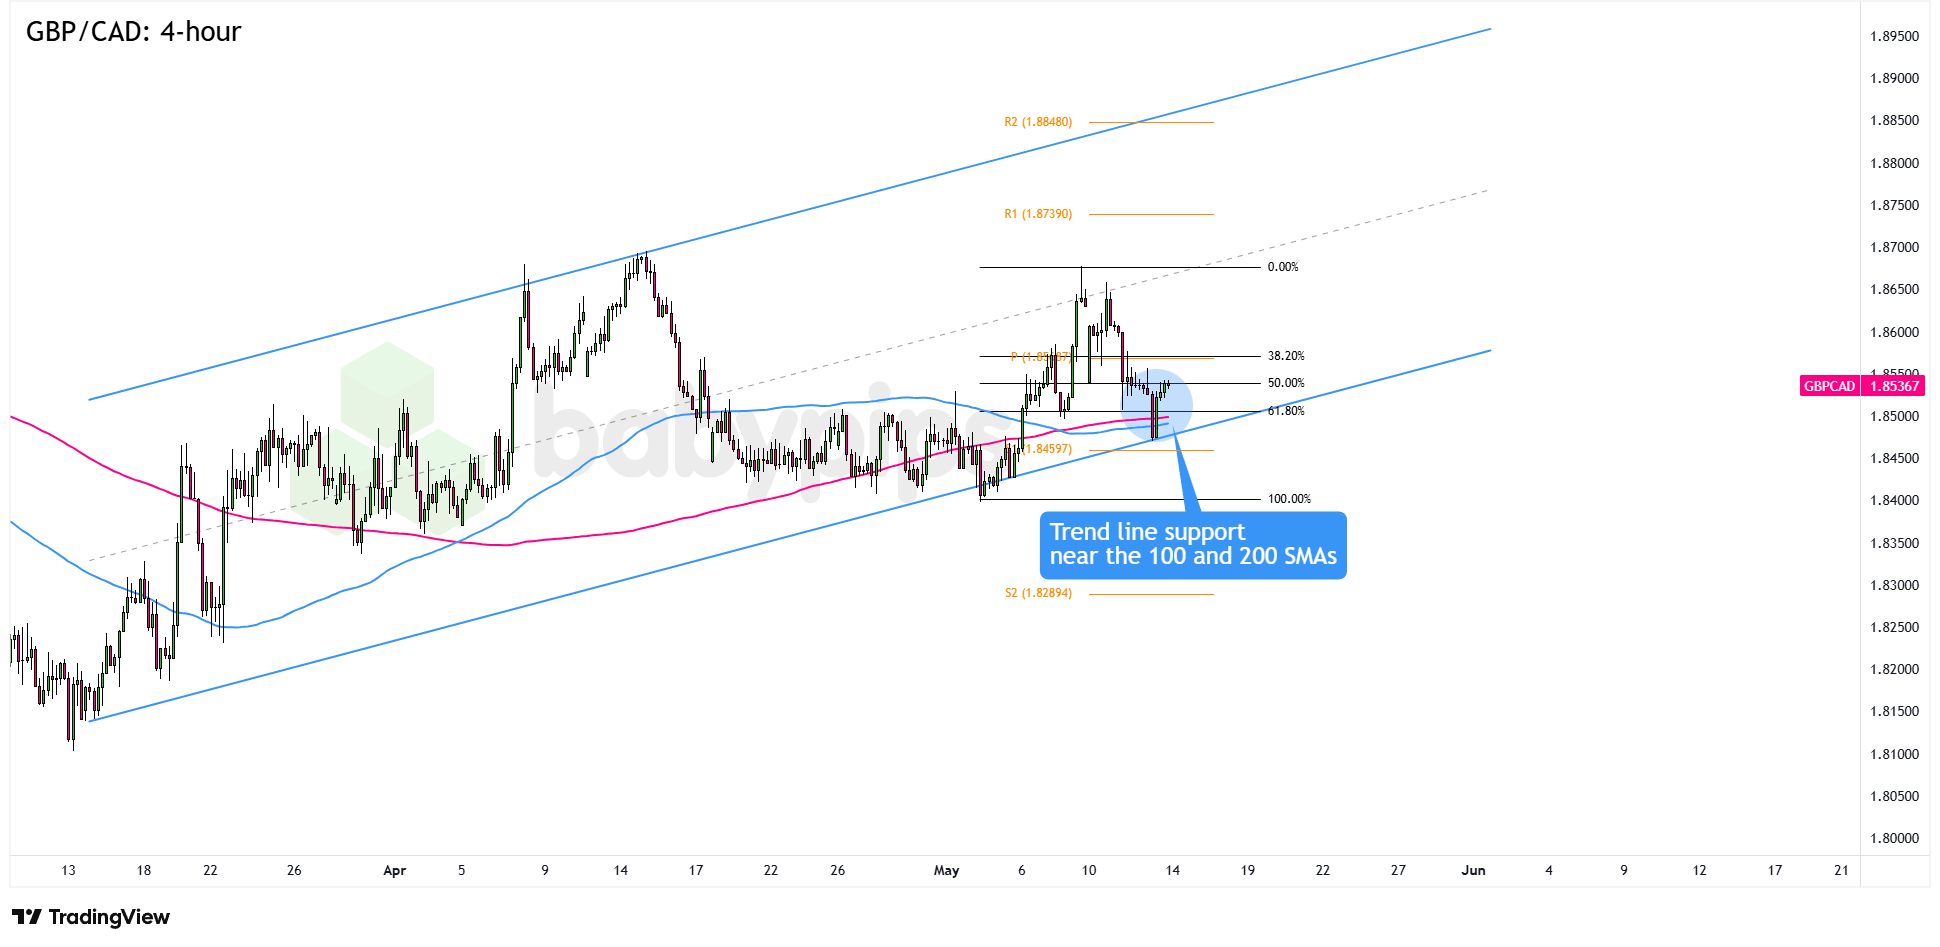
GBP/CAD: 4-hour
GBP/CAD 4-hour Forex Chart Faster with TradingView
Uncertainty over U.K. Prime Minister Starmer’s leadership weighed on the British pound for most of the week.
The Canadian dollar, meanwhile, managed to gain a few pips against the majors after crude oil prices bounced on fading hopes for progress in U.S.-Iran negotiations.
Will the tides turn for GBP/CAD with the U.K. set to print a round of mid-tier data while oil prices pull back from their weekly highs?
GBP/CAD has been trending higher since March, but buyers hit a wall near the 1.8650 psychological level. That area also lines up with the midpoint of an ascending channel that’s been guiding price action since mid-March.Remember that directional biases and volatility conditions in market price are typically driven by fundamentals. If you haven’t yet done your homework on the British pound and the Canadian dollar, then it’s time to check out the economic calendar and stay updated on daily fundamental news!
The pair is now hanging out closer to 1.8540, putting it within striking distance of the 1.8500 zone. That level is worth watching because it lines up with the bottom of the channel, the S1 Pivot Point at 1.8460, and the 100 and 200 SMAs.
A few more bullish candlesticks from here could bring buyers back in and push GBP/CAD toward the 1.8650 mid-channel area, if not the 1.8800 channel resistance zone.
But if this week’s selling pressure picks up again, GBP/CAD could break below the channel support and slide toward the 1.8400 May lows. A stronger break could even put fresh monthly lows on the table.
Whichever bias you end up trading, don’t forget to practice proper risk management and stay aware of top-tier catalysts that could influence overall market sentiment!
GBP/CAD has been climbing inside an ascending channel since March, but if you’re not familiar with how to read that kind of market structure, the setup can be hard to interpret. Premium members can read our lesson:
📖 Market Structure: Trends and Ranges
Reading this helps you understand how to identify a trending market, the sequence of higher highs and higher lows that defines an uptrend, and what it means when price pulls back toward channel support.
And if you’re not a Premium subscriber yet, now’s a good time to sign up.
With Babypips Premium, you get full access to School of Pipsology lessons that help you understand not just what a chart pattern looks like, but the market structure principles behind why price moves the way it does.


