





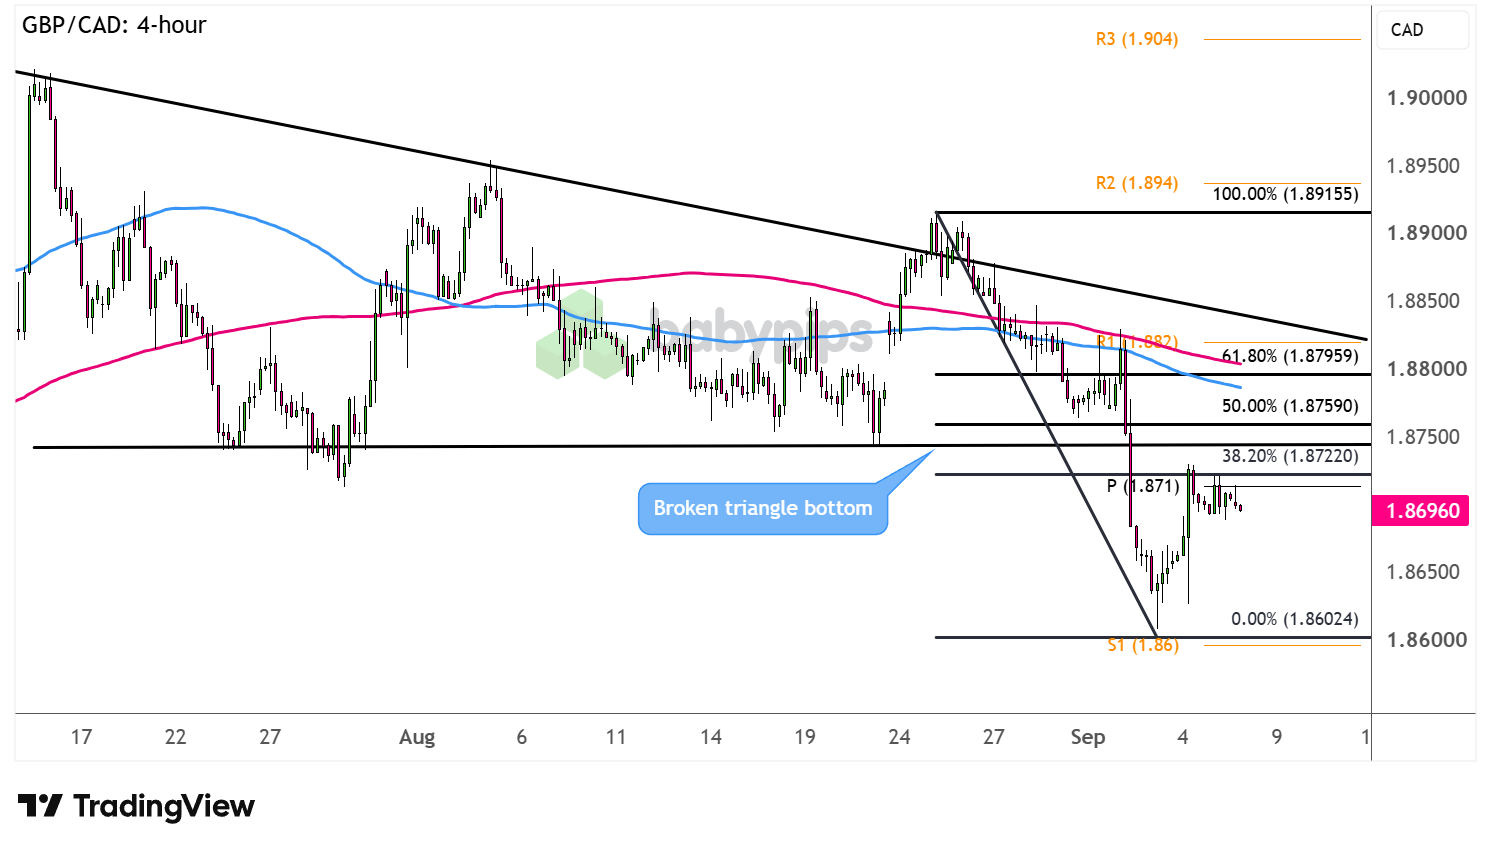
GBP/CAD recently broke through its descending triangle bottom and appears to be pulling up for a retest.
Will resistance hold?
Check out these potential correction levels on the 4-hour chart.
GBP/CAD: 4-hour
GBP/CAD 4-hour Forex Chart Faster With TradingView
Rising crude oil prices have been lifting the correlated Loonie these days, as strikes between the U.S. and Iran continue to keep global supply concerns elevated.
Meanwhile, risk-off flows on geopolitical tensions appear to be taking their toll on the British pound, which often acts as a “risk currency.”
Can bearish momentum pick up after this triangle breakdown?
GBP/CAD fell through the triangle support around the 1.8750 minor psychological mark then found a floor close to 1.8600 and S1.Remember that directional biases and volatility conditions in market price are typically driven by fundamentals. If you haven’t yet done your homework on the Canadian dollar and the British pound, then it’s time to check out the economic calendar and stay updated on daily fundamental news!
From there, the Fibonacci retracement tool shows potential levels where sellers could be looking to jump in. The 38.2% level is close to the Pivot Point (1.8710), while the 50% Fib is just slightly above the broken triangle bottom.
The line in the sand for a bearish correction could be the 61.8% level that coincides with the dynamic resistance at the moving averages.
Look out for reversal candlesticks at any of these areas. Holding as resistance could allow the selloff to gain traction, possibly taking GBP/CAD back down to the swing low or lower.
Whichever bias you end up trading, don’t forget to practice proper risk management and stay aware of top-tier catalysts that could influence overall market sentiment.
Disclaimer:
Please be aware that the technical analysis content provided herein is for informational and educational purposes only. It should not be construed as trading advice or a suggestion of any specific directional bias. Technical analysis is just one aspect of a comprehensive trading strategy. The technical setups discussed are intended to highlight potential areas of interest that other traders may be observing. Ultimately, all trading decisions, risk management strategies, and their resulting outcomes are the sole responsibility of each individual trader. Please trade responsibly.
This GBP/CAD setup involves a breakdown below a descending triangle that’s now pulling back up to retest the broken support as resistance, a pattern you may not be fully familiar with. Premium members can read our lesson:
📖 The Break-and-Retest: A Higher-Probability Breakout Entry
Reading this helps you understand why most initial breakouts fail, why waiting for a retest filters out those traps, and how to judge whether the retest of the old triangle bottom is likely to hold as resistance or give way.
And if you’re not a Premium subscriber yet, now’s a good time to sign up.
With Babypips Premium, you get full access to School of Pipsology lessons that help you understand not just where price broke down, but why waiting for the retest gives you a much stronger read on whether that level will hold.



