





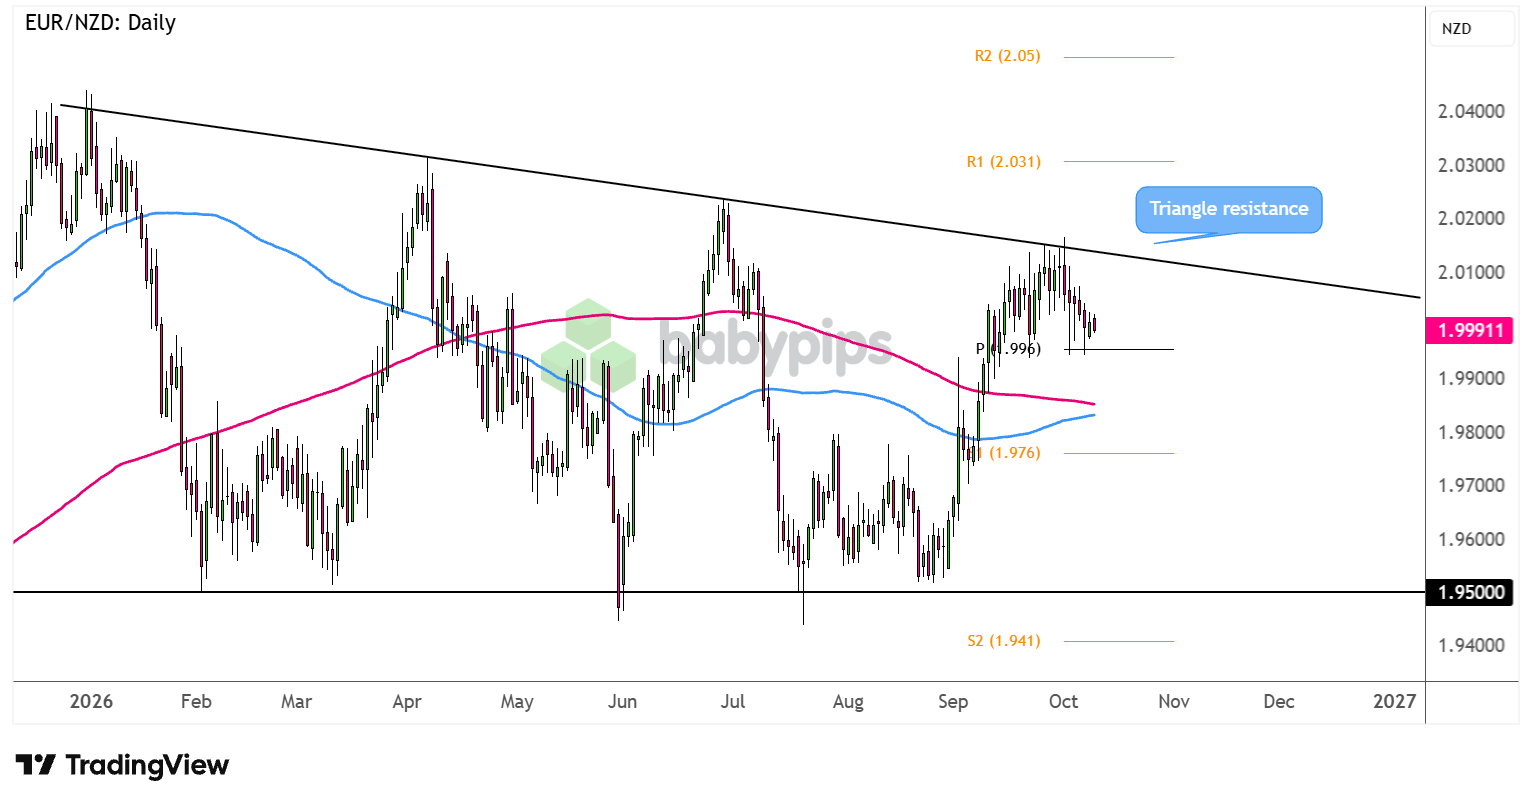
EUR/NZD’s climb seems to be stalling as the pair hits a long-term ceiling at its descending triangle resistance.
Will bearish momentum pick up from here?
Check out the potential targets on the daily chart!
EUR/NZD: Daily
EUR/NZD Daily Forex Chart Faster with TradingView
Elevated geopolitical tensions have weighed on risk-taking for the most part of September, dragging the Kiwi south against the relatively lower-yielding euro.
However, the shared currency’s gains were also capped when the spotlight shifted to France’s fiscal troubles while the country’s elections loomed closer.
Is EUR/NZD in for more downside?
EUR/NZD is down to its pivot point support (1.9960) after retreating from its long-term descending triangle resistance.Remember that directional biases and volatility conditions in market price are typically driven by fundamentals. If you haven’t yet done your homework on the euro and the New Zealand dollar, then it’s time to check out the economic calendar and stay updated on daily fundamental news!
Should sellers step up their game, the next potential downside targets to watch are S1 (1.9760) then the triangle bottom at the 1.9500 major psychological mark, just above S2 (1.9410).
On the other hand, a strong bounce off the pivot point could spur another test of the triangle top close to the 2.0100 mark or perhaps a break higher. Note that the 100 SMA looks ready to cross above the 200 SMA to reflect upside pressure, while EUR/NZD is also trading safely above both dynamic inflection points.
Whichever bias you end up trading, don’t forget to practice proper risk management and stay aware of top-tier catalysts that could influence overall market sentiment!
EUR/NZD is testing a cluster of chart levels, from its descending triangle resistance to pivot points and the 1.9500 psychological mark, but you may not be familiar with how traders decide which of these levels matter most. Premium members can read our lesson:
📖 Where Breakouts Happen: Mapping the Key Levels
Reading this helps you understand which key levels tend to produce meaningful breakouts, how to rank levels like triangle boundaries, pivot points, and psychological marks, and how to map them before price gets there.
And if you’re not a Premium subscriber yet, consider joining.
With Babypips Premium, you get full access to School of Pipsology lessons that help you understand not just where price is sitting on the chart, but which levels are most likely to decide the next move.



