


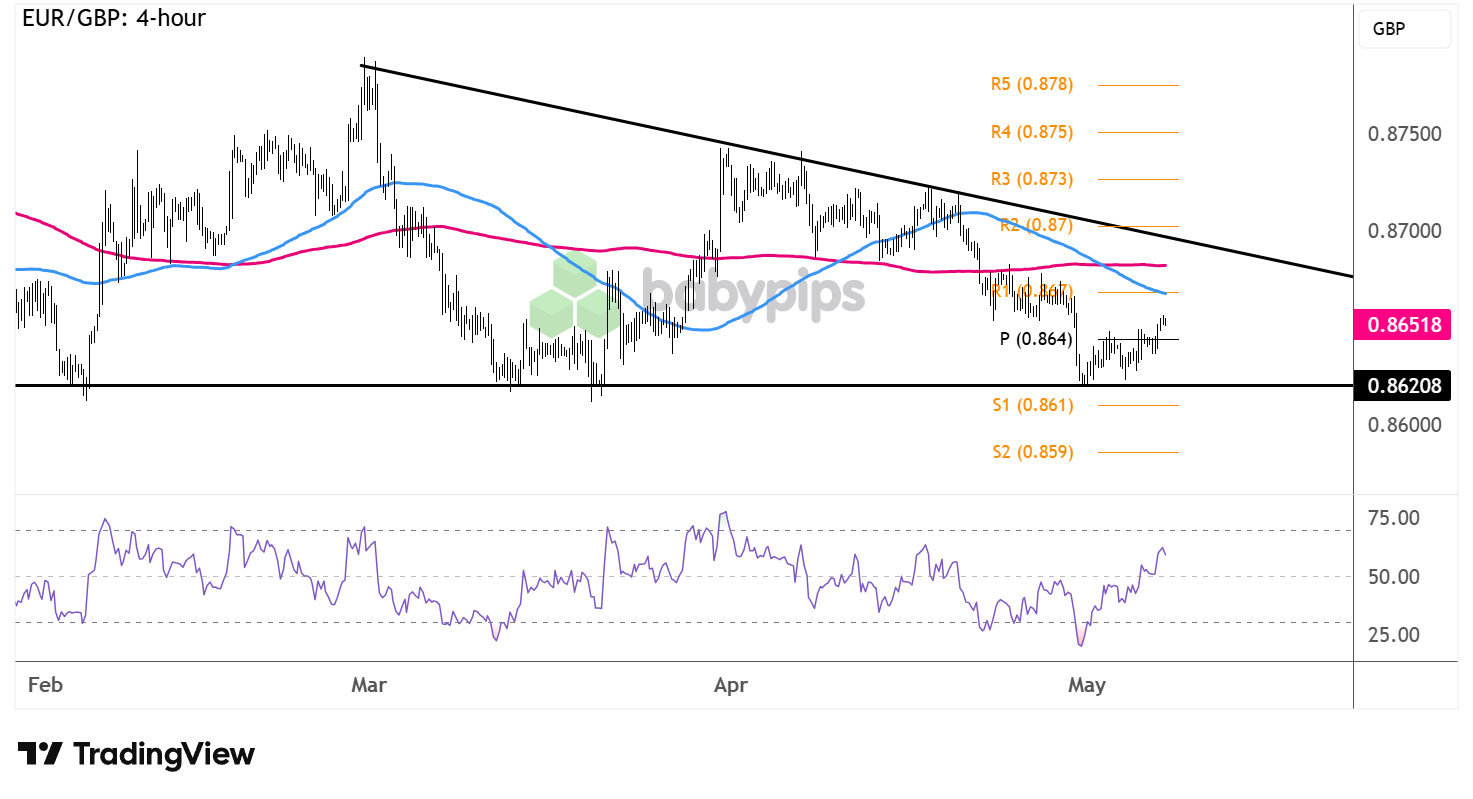
EUR/GBP has formed lower highs and found support around .8620 to create a descending triangle pattern.
Is another move back to the resistance due?
Check out these near-term inflection points on the 4-hour time frame!
EUR/GBP: 4-hour
EUR/GBP 4-hour Forex Chart Faster With TradingView
Policymakers over at the ECB still seem divided on the direction to take when it comes to adjusting interest rates. Meanwhile, BOE officials leaned less dovish in their latest statement, with one hawkish member already calling for an immediate rate hike.
This divergence in policy paths has dragged EUR/GBP to the bottom of its descending triangle in the previous week, though bulls once again defended support while risk-off flows kept Sterling gains in check.
Can the pair sustain its bullish trajectory, or will we see a breakdown attempt?
The pair has just climbed past the pivot point (.8640) to suggest a bit of upside momentum on its side, possibly enough to take it to the next bullish target at R1 (.8670) then the triangle top close to the .8700 major psychological mark.Remember that directional biases and volatility conditions in market price are typically driven by fundamentals. If you haven’t yet done your homework on the euro and the British pound, then it’s time to check out the economic calendar and stay updated on daily fundamental news!
Just keep an eye out for another dip to the triangle support just above S1 (.8610), as long red candlesticks breaking below this region could confirm that a selloff is in the works.
If that happens, EUR/GBP could set its sights on the next downside target at S2 (.8590) or extend its slump by the same height as the triangle formation.
Whichever bias you end up trading, don’t forget to practice proper risk management and stay aware of top-tier catalysts that could influence overall market sentiment.
Disclaimer:
Please be aware that the technical analysis content provided herein is for informational and educational purposes only. It should not be construed as trading advice or a suggestion of any specific directional bias. Technical analysis is just one aspect of a comprehensive trading strategy. The technical setups discussed are intended to highlight potential areas of interest that other traders may be observing. Ultimately, all trading decisions, risk management strategies, and their resulting outcomes are the sole responsibility of each individual trader. Please trade responsibly.
This article touches on ECB and BOE policy divergence, and if terms like “hawkish” and “dovish” aren’t fully clear yet, Premium members can read our lesson:
📖 Hawkish vs. Dovish: How to Read Central Bank Language
Reading this helps you understand what hawkish and dovish signals actually mean, how to identify where a central bank sits on the policy spectrum, and why a single statement can move a currency pair more than a rate decision itself.
And if you’re not a Premium subscriber yet, now’s a good time to sign up.
With Babypips Premium, you get full access to School of Pipsology lessons that help you understand not just what the chart is showing, but the central bank dynamics and policy signals driving the move.


