





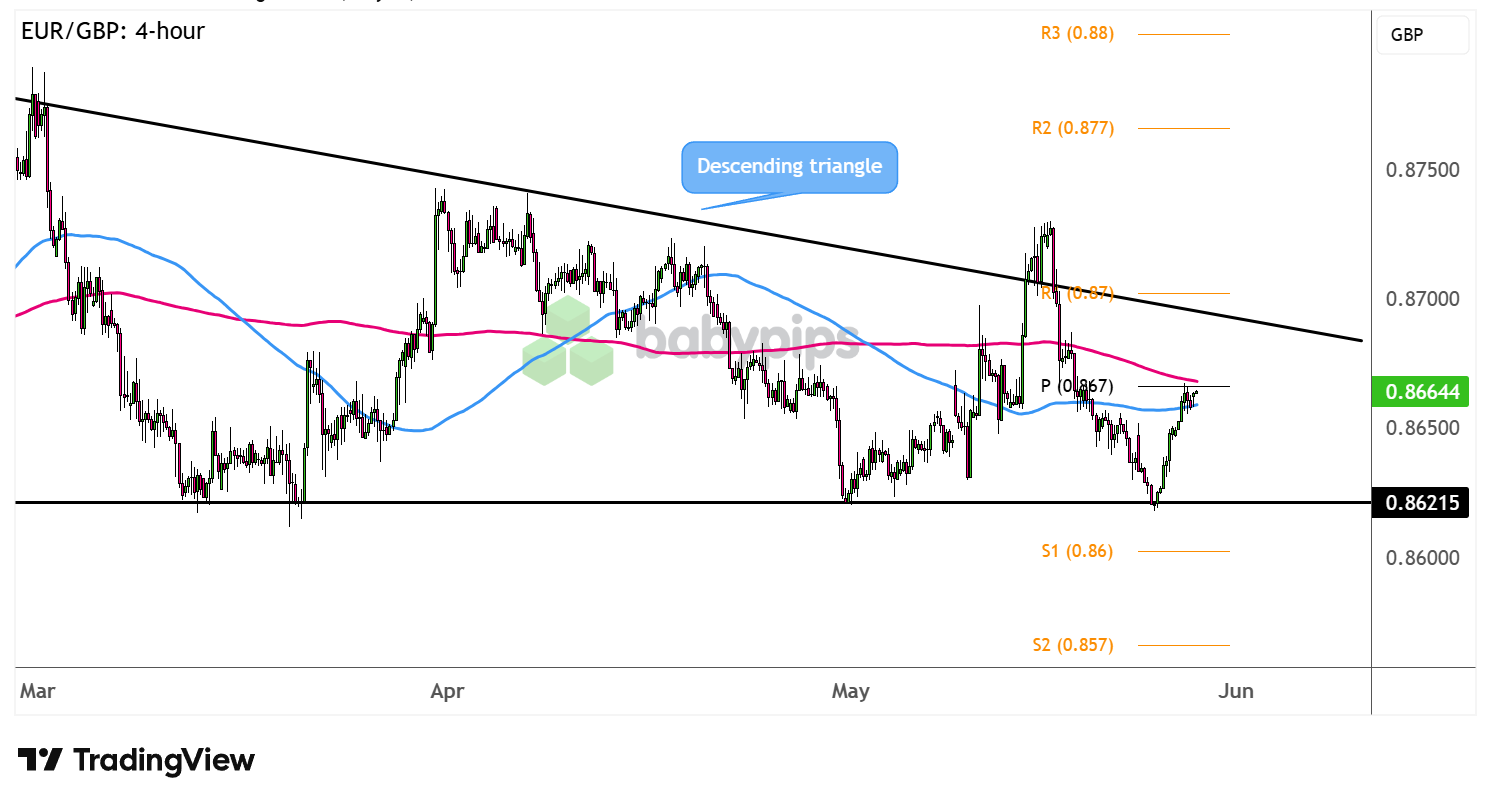
With EUR/GBP bouncing off the strong support zone around .8620, bulls appear to have their sights set on the next ceiling.
Will the top of the triangle hold as resistance?
Here are the levels to look out for on the 4-hour time frame.
EUR/GBP: 4-hour
EUR/GBP 4-hour Forex Chart Faster With TradingView
Hawkish ECB commentary has been giving the euro a strong boost recently, as traders are likely recalibrating rate hike expectations, though pound bulls are refusing to back down despite mixed U.K. jobs and inflation data last week.
Risk appetite has also leaned mostly in favor of the U.K. currency, as hopes for a diplomatic resolution to the US-Iran war are still in play.
Is EUR/GBP about to retreat from its rally soon?
EUR/GBP has gained momentum on its bounce but appears to be hitting a barrier at the pivot point (.8670), which happens to be around the 200 SMA dynamic inflection point.Remember that directional biases and volatility conditions in market price are typically driven by fundamentals. If you haven’t yet done your homework on the euro and the British pound, then it’s time to check out the economic calendar and stay updated on daily fundamental news!
The 100 SMA is below the 200 SMA on this time frame, suggesting that the path of least resistance is to the downside or that the ceiling is more likely to hold than to break. If so, the pair could make its way back to the bottom of the triangle to test support.
Should the pair still manage to bust through the near-term roadblock, keep an eye out for the next potential resistance at the top of the triangle, which is right around the .8700 major psychological mark and R1.
Stronger bullish momentum past that point could confirm a break higher, possibly taking EUR/GBP up to the next targets at R2 (.8770) then R3 (.8800).
Whichever bias you end up trading, don’t forget to practice proper risk management and stay aware of top-tier catalysts that could influence overall market sentiment.
Disclaimer:
Please be aware that the technical analysis content provided herein is for informational and educational purposes only. It should not be construed as trading advice or a suggestion of any specific directional bias. Technical analysis is just one aspect of a comprehensive trading strategy. The technical setups discussed are intended to highlight potential areas of interest that other traders may be observing. Ultimately, all trading decisions, risk management strategies, and their resulting outcomes are the sole responsibility of each individual trader. Please trade responsibly.
This article touches on ECB and BOE policy divergence, and if terms like “hawkish” and “dovish” aren’t fully clear yet, Premium members can read our lesson:
📖 Hawkish vs. Dovish: How to Read Central Bank Language
Reading this helps you understand what hawkish and dovish signals actually mean, how to identify where a central bank sits on the policy spectrum, and why a single statement can move a currency pair more than a rate decision itself.
And if you’re not a Premium subscriber yet, now’s a good time to sign up.
With Babypips Premium, you get full access to School of Pipsology lessons that help you understand not just what the chart is showing, but the central bank dynamics and policy signals driving the move.



