





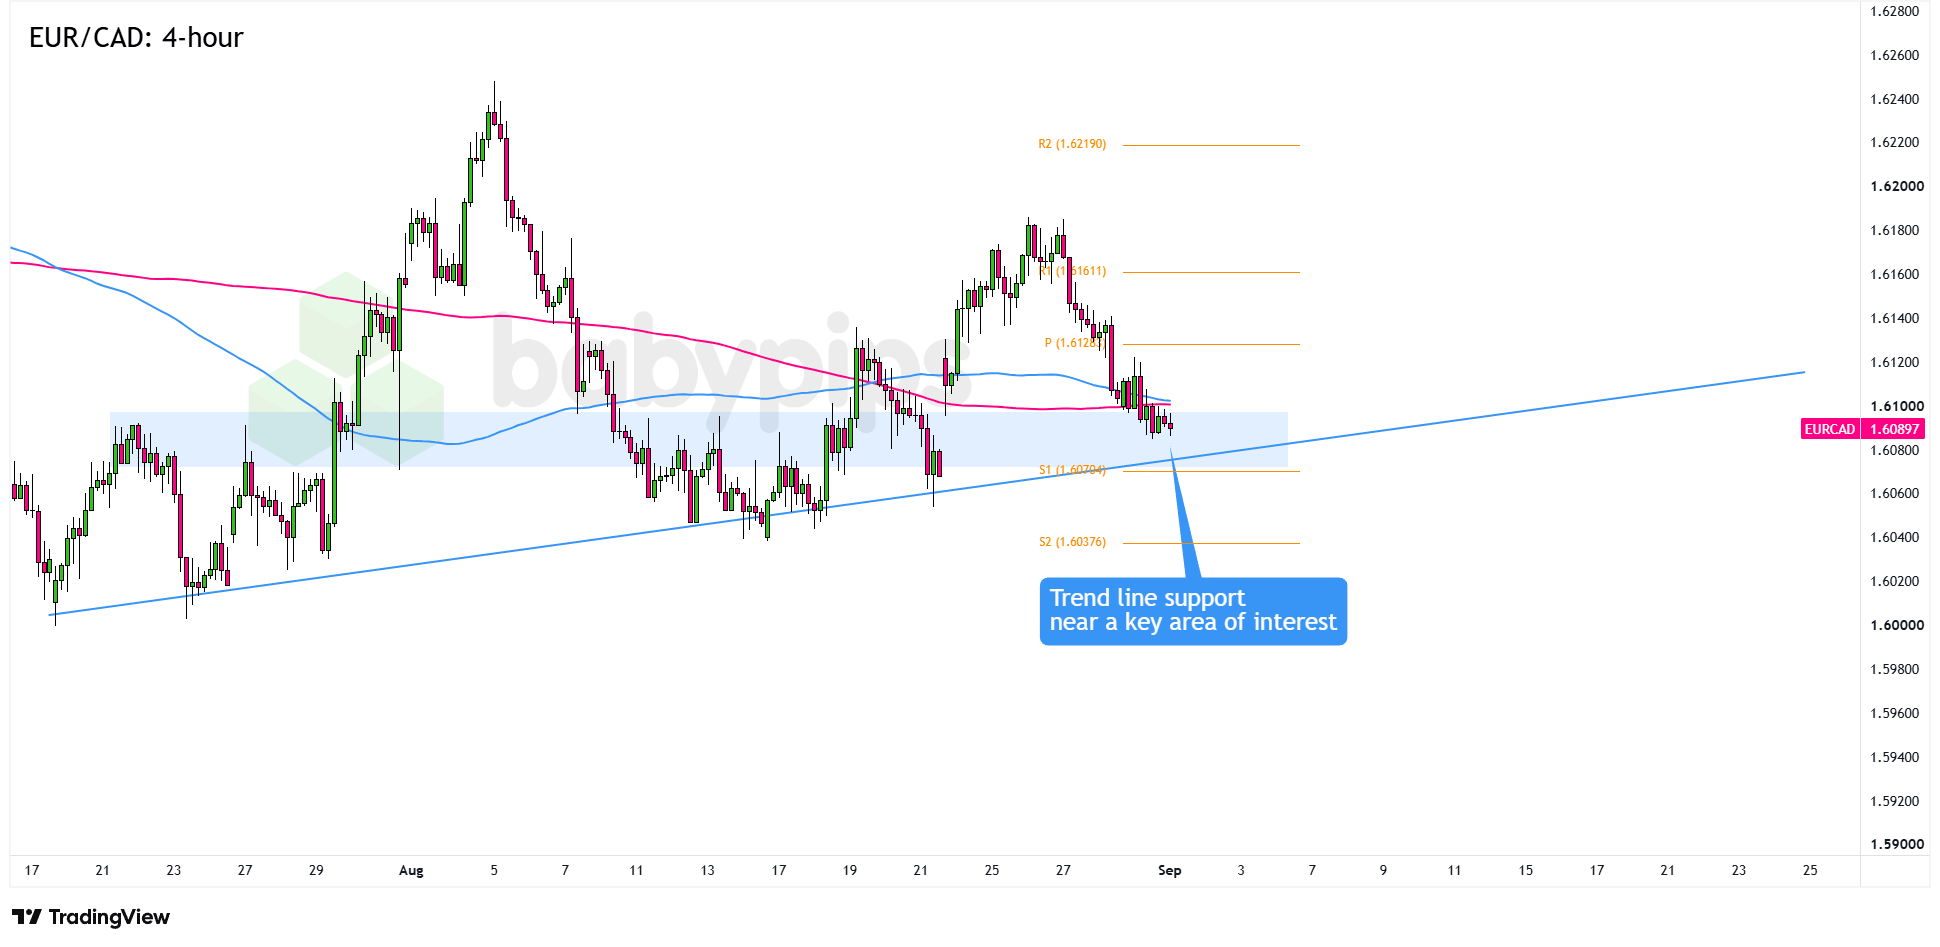
EUR/CAD has been sliding throughout August and is now testing trendline support around the 1.6100 psychological level.
Will bulls find enough reason to bounce, or will bears break through and drag the pair to fresh lows?
Here are the potential inflection points on the 4-hour chart:
EUR/CAD: 4-hour
EUR/CAD 4-hour Forex Chart Faster with TradingView
Tuesday brings several potential euro catalysts, including the Euro Area’s final August manufacturing PMI and flash inflation estimate. Germany’s preliminary inflation rate came in at 2.9% year over year, just below the 3.0% forecast but firm enough to keep September ECB hike bets intact. A similar or stronger euro area reading could help the single currency find its footing at support.
On the other side of the pair, the Loonie gained Monday as WTI crude jumped more than 3% after US and Iranian forces exchanged strikes for the first time in over a month, reviving Strait of Hormuz supply fears.
Attention now turns to the Bank of Canada’s September 2 decision, with markets seeing just a 3% chance of anything other than a seventh straight hold at 2.25%. Macklem’s press conference could still move CAD if he discusses the inflation impact of higher oil prices or signals a change in the Bank’s data-dependent stance.
EUR/CAD has trended lower since peaking near 1.6180 in late August. The latest wave of selling has pulled the pair into a stacked support zone where the rising trend line, the 1.6100 psychological level, and S1 at 1.6070 come together.Remember that directional biases and volatility conditions in market price are typically driven by fundamentals. If you haven’t yet done your fundie homework on the euro and the Canadian dollar, then it’s time to check out the economic calendar and stay updated on daily fundamental news!
If buyers defend the trend line and 1.6100 area, EUR/CAD could recover toward the Pivot Point at 1.6128. A stronger bounce could carry the pair toward the 1.6200 resistance zone and R2 at 1.6219. Bullish reversal candles around the support confluence would offer an early sign that buyers are stepping in.
On the flip side, a clean break below the trend line and 1.6100 could open the door to S1 at 1.6070, followed by the 1.6050 support zone.
If sellers keep pressing, S2 at 1.6038 would be the next downside target. Strong bearish candles closing below the trend line would keep August’s downswing firmly in play.
Whichever bias you end up trading, don’t forget to practice proper risk management and stay aware of top-tier catalysts that could influence overall market sentiment!
This EUR/CAD setup is built around a support zone where a rising trendline, a key psychological level, and a pivot support level all converge at once. Premium members can read our lesson:
📖 Confluence: Stacking the Odds in Your Favor
Reading this helps you understand why multiple technical factors aligning at the same level create a stronger signal than any one factor alone, what makes a stacked support zone more significant than a single line on a chart, and how to evaluate setup quality before committing to a direction.
And if you’re not a Premium subscriber yet, now’s a good time to sign up.
With Babypips Premium, you get full access to School of Pipsology lessons that help you understand not just where support sits on a chart, but why a zone where multiple factors overlap carries more analytical weight than any single level on its own.



