





EUR/AUD just busted through a mid-range consolidation!
Will the bulls power through range resistance, or will the bears step in for another rejection?
Here’s what we’re seeing on the 4-hour time frame:
EUR/AUD: 4-hour
EUR/AUD 4-hour Forex Chart by TradingView
Australia’s July jobs report gave AUD bears a fresh catalyst on Thursday, with net employment unexpectedly falling by 15,800 versus forecasts for a 15,000 gain. The unemployment rate also climbed to 4.5%, its highest since late 2021.
On the other side of the pair, Friday’s Euro Area flash PMI reports could give the euro another boost. July’s composite PMI already climbed to an eight month high of 52.0, while markets continue to price in roughly an 84% chance of an ECB rate hike in September as Euro Area inflation holds near 2.9%.
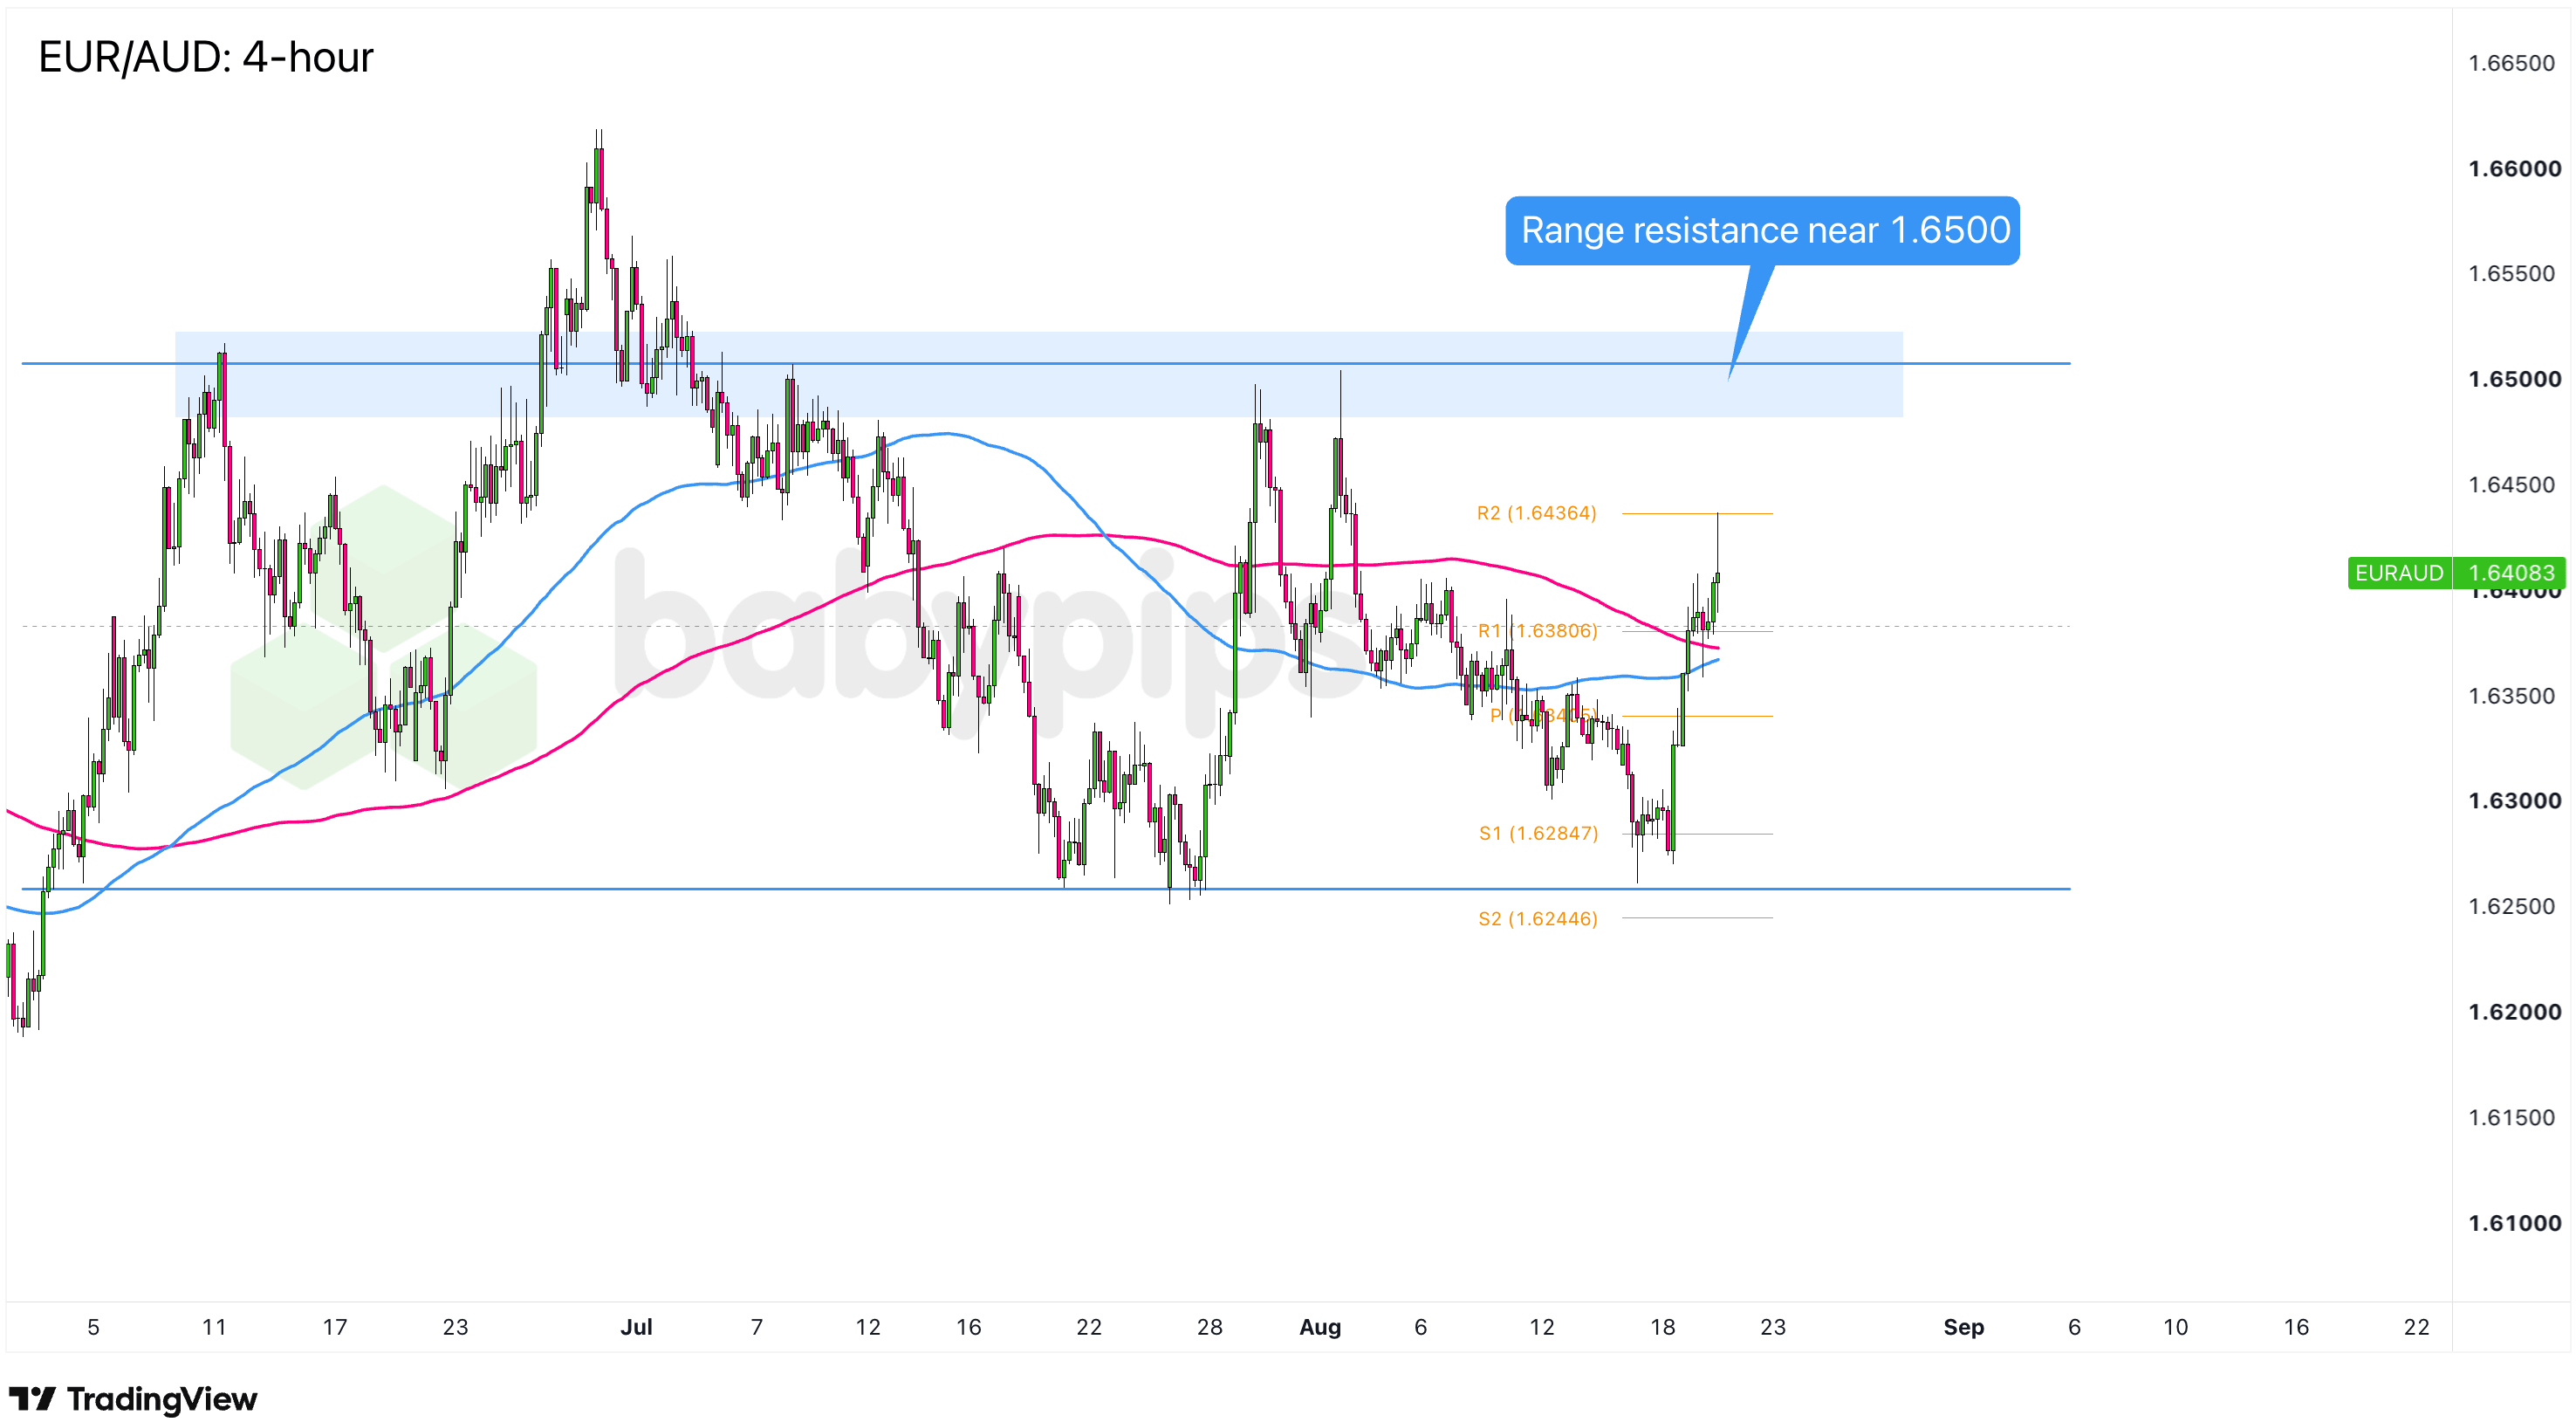
EUR/AUD has been chopping around in a wide range between support near 1.6250 and resistance around 1.6500 for the past couple of months. After sliding to lows near 1.6280 in mid-August, the pair bounced sharply and climbed above both the R1 Pivot Point at 1.6381 and R2 at 1.6436. The moving averages are also starting to curl higher, and with price hovering around 1.6408, the 1.6500 range ceiling looks like the next key test.Remember that directional biases and volatility conditions in market price are typically driven by fundamentals. If you haven’t yet done your fundie homework on the euro and the Australian dollar, then it’s time to check out the economic calendar and stay updated on daily fundamental news!
A sustained break above 1.6500 could open the door to the previous swing highs near 1.6620 or the 1.6650 area of interest. Stronger-than-expected Euro Area PMI reports on Friday could give bulls the extra push they need to make that breakout stick.
If EUR/AUD stalls at range resistance instead, the R2 Pivot Point at 1.6436 is the first support area to watch. A deeper rejection, especially if the PMI reports disappoint, could drag price back toward mid-range support near 1.6350 or the 1.6300 range floor.
Whichever bias you end up trading, don’t forget to practice proper risk management and stay aware of top-tier catalysts that could influence overall market sentiment.
Disclaimer:
Please be aware that the technical analysis content provided herein is for informational and educational purposes only. It should not be construed as trading advice or a suggestion of any specific directional bias. Technical analysis is just one aspect of a comprehensive trading strategy. The technical setups discussed are intended to highlight potential areas of interest that other traders may be observing. Ultimately, all trading decisions, risk management strategies, and their resulting outcomes are the sole responsibility of each individual trader. Please trade responsibly.
The AUD/USD reaction to Australia’s jobs report, a brief spike followed by a quick reversal, follows a pattern that plays out at virtually every major data release. Premium members can read our lesson:
📖 From Data to Price Action: What Happens When Big News Hits
Reading this helps you understand the two-phase reaction that follows major economic data, how to tell the algorithmic spike from the analytical move, and why the first price move after a release isn’t always the one that holds.
And if you’re not a Premium subscriber yet, now’s a good time to sign up.
With Babypips Premium, you get full access to School of Pipsology lessons that help you understand not just that price moved after a release, but why it moved that way and how to read those two phases in real time.



