


After days of recovery, CHF/JPY looks set to extend a weeks-long trend!
Will the pair see bearish pressure in the next few days?
Here’s what’s brewing on the 4-hour time frame:
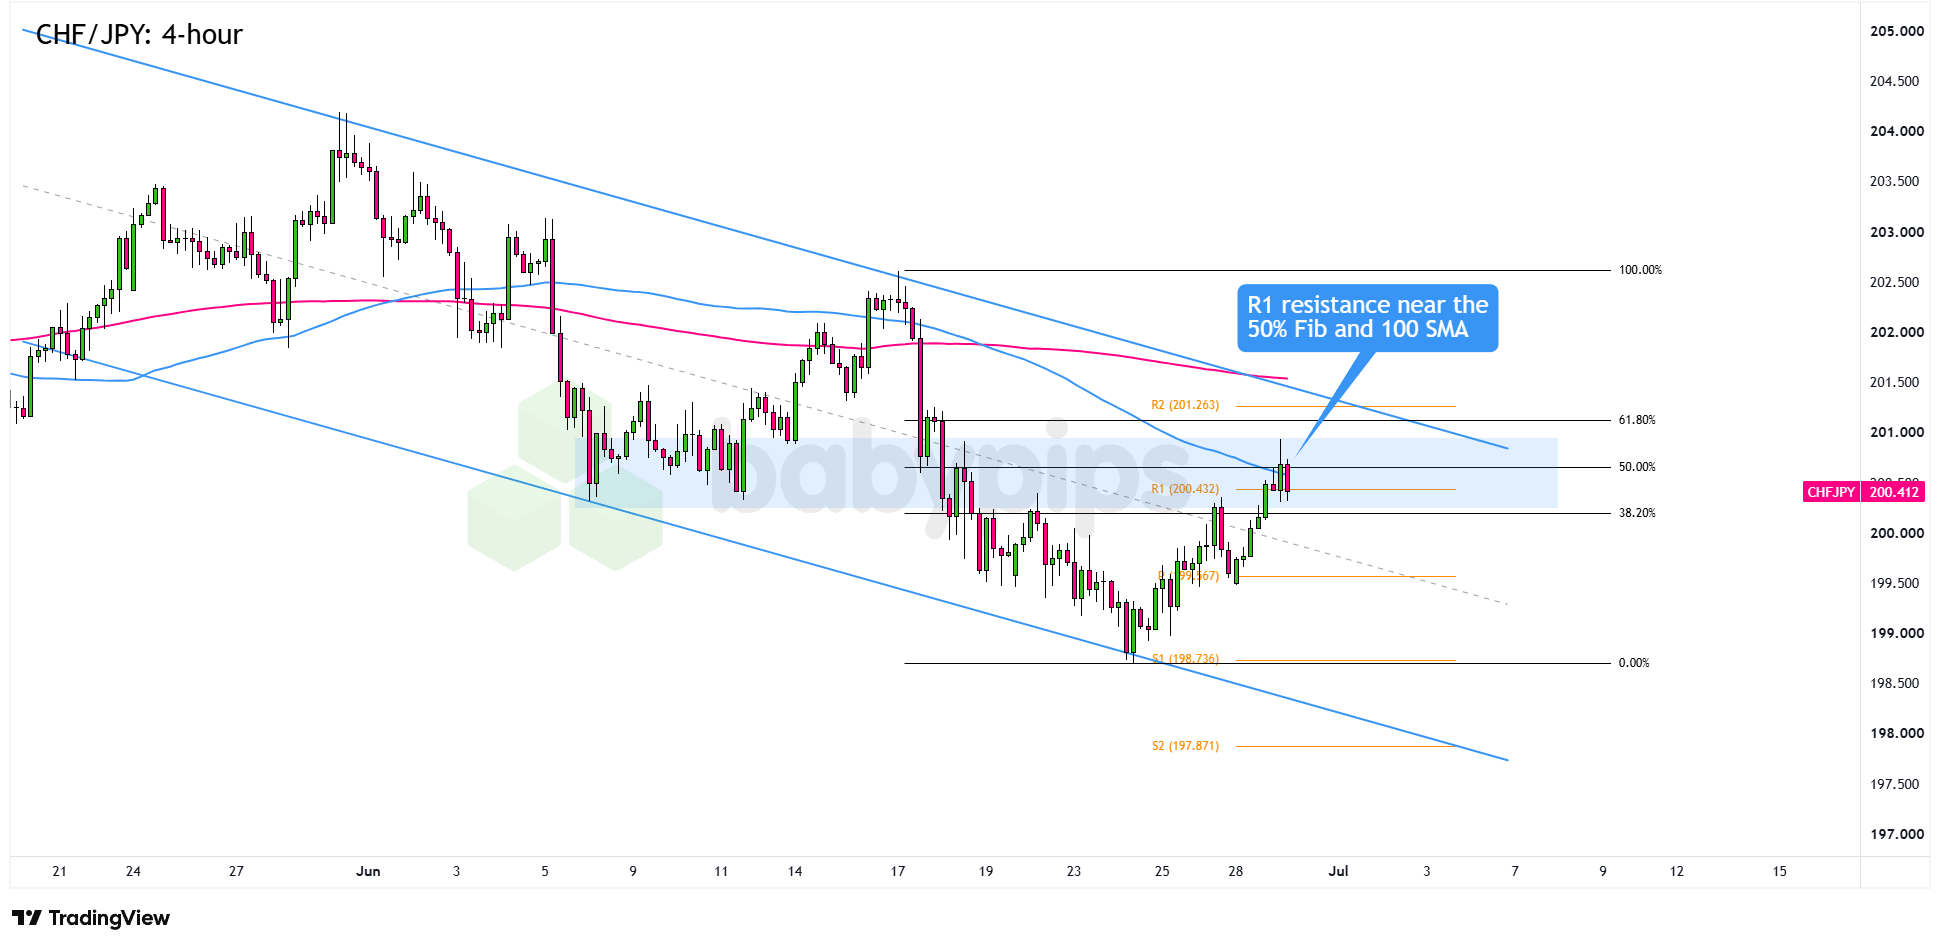
CHF/JPY: 4-hour
CHF/JPY 4-hour Forex Chart Faster With TradingView
USD/JPY’s grind up to 162.40 on Tuesday, the yen’s weakest mark against the dollar since 1986, is keeping Japanese officials firmly on intervention watch, and any verbal or actual yen-supportive action could spill into crosses like this one.
Meanwhile, the Swiss franc has its own setup brewing, with today’s Swiss KOF Leading Indicators on deck and pre-NFP positioning ahead of Thursday’s U.S. jobs report potentially keeping the dollar, and broader safe-haven flows, choppy into the print.
CHF/JPY has been making lower highs and lower lows inside a descending channel since late May, and the recent bounce off the S1 pivot near 198.74 has carried price straight into a resistance cluster where R1 at 200.432, the 50% Fibonacci retracement, and the 100 SMA are all stacking up just beneath the channel’s upper trendline.Remember that directional biases and volatility conditions in market price are typically driven by fundamentals. If you haven’t yet done your homework on the Swiss franc and the Japanese yen, then it’s time to check out the economic calendar and stay updated on daily fundamental news!
Price is currently changing hands near 200.41, sitting right inside the confluence, with R2 up at 201.26 lining up close to the 61.8% retracement, and S2 down at 197.87 marking the next floor below S1.
Keep close tabs on a potential candle close above 200.60 and the channel’s upper trendline to suggest CHF/JPY is breaking free of the slide, which could open the door toward R2 at 201.263.
On the flip side, if the R1, 50% Fib, and 100 SMA confluence holds and JPY intervention jawboning gathers steam, CHF/JPY could roll back over toward the channel floor and the S1 pivot at 198.736, with S2 at 197.871 the next stop below that.
Whichever bias you end up trading, don’t forget to practice proper risk management and stay aware of top-tier catalysts that could influence overall market sentiment.
Disclaimer:
Please be aware that the technical analysis content provided herein is for informational and educational purposes only. It should not be construed as trading advice or a suggestion of any specific directional bias. Technical analysis is just one aspect of a comprehensive trading strategy. The technical setups discussed are intended to highlight potential areas of interest that other traders may be observing. Ultimately, all trading decisions, risk management strategies, and their resulting outcomes are the sole responsibility of each individual trader. Please trade responsibly.
This CHF/JPY setup is testing a single price zone where three separate technical signals, the R1 pivot, the 50% Fibonacci retracement, and the 100 SMA, are all stacking up at once. Premium members can read our lesson:
📖 Confluence: Stacking the Odds in Your Favor
Reading this helps you understand why a level backed by multiple independent signals carries more weight than a single line on a chart, how to score a setup like this CHF/JPY confluence zone before deciding whether it’s worth trading, and why a breakout or rejection at this particular price band matters more than it would at an isolated level.
And if you’re not a Premium subscriber yet, now could be a good time to join.
With Babypips Premium, you get full access to School of Pipsology lessons that help you understand not just where a confluence zone sits on a chart, but how to build complete technical setups around it from the ground up.


