





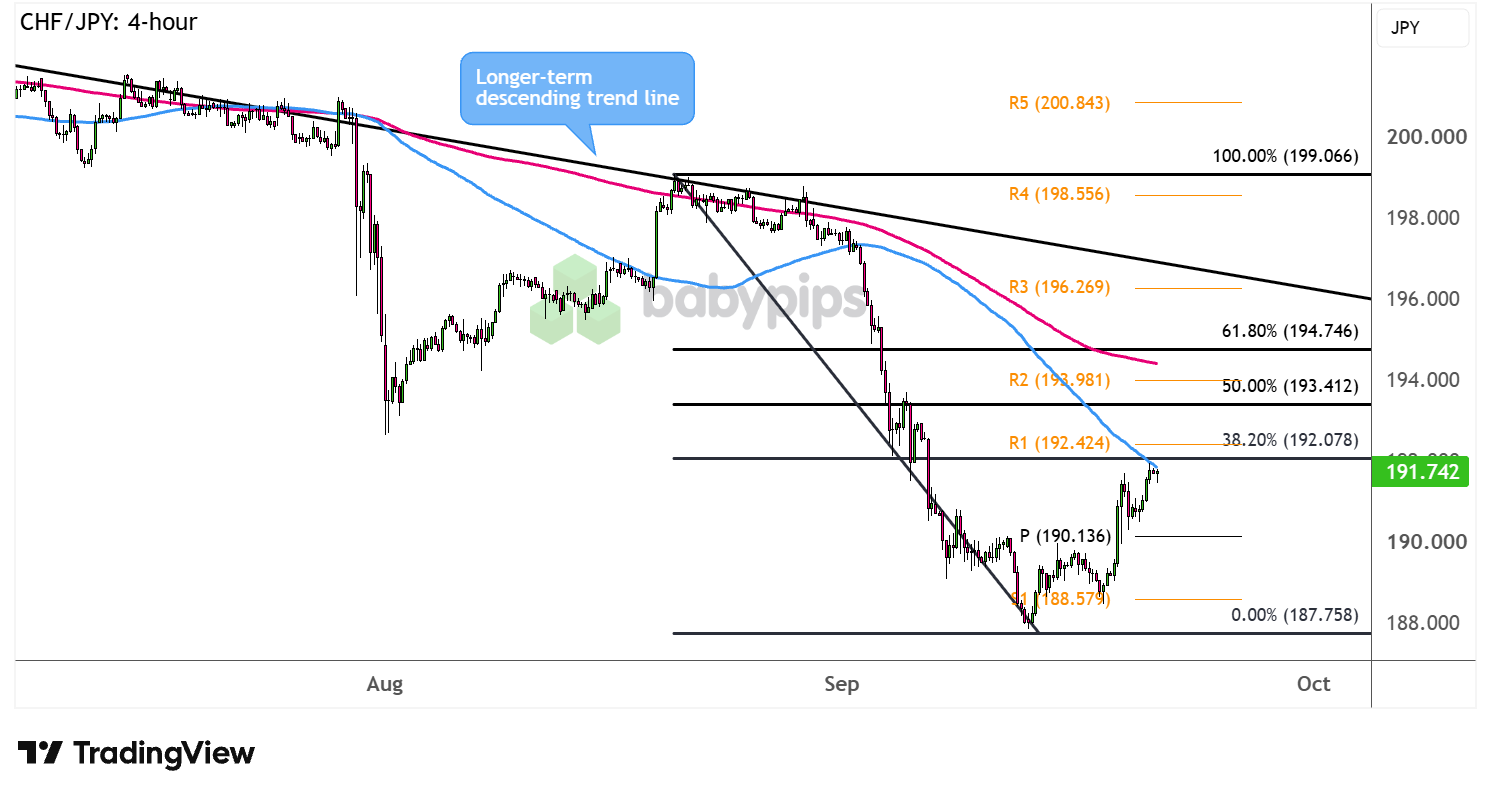
CHF/JPY appears to be in correction mode as it pulls up from its recent selloff.
Are sellers waiting to hop in at the Fib retracement levels?
Take a look at these potential resistance zones on the 4-hour time frame.
CHF/JPY: 4-hour
CHF/JPY 4-hour Forex Chart Faster with TradingView
The Japanese yen has been on a tear for the better part of September, fueled by strengthening BOJ tightening expectations and escalating geopolitical tensions.
But now that the BOJ already announced a “dovish hike” last week, JPY has returned some of its gains while the voting split revealed that the decision wasn’t unanimous.
Meanwhile, the franc has been raking in its share of safe-haven gains while broader sentiment leans risk-off.
Can CHF/JPY keep climbing from here?
CHF/JPY is already testing the 38.2% Fibonacci retracement level close to R1 (192.42) that might be the first barrier to rallies.Remember that directional biases and volatility conditions in market price are typically driven by fundamentals. If you haven’t yet done your fundie homework on the Swiss franc and the Japanese yen, then it’s time to check out the economic calendar and stay updated on daily fundamental news!
Should sellers return right here, look out for bearish momentum that could drag the pair back down to the pivot point (190.13) or the swing low near S1 (188.58).
A larger bounce could still reach the 50% Fib, R2 (193.98) or the 61.8% level closer to the 200 SMA dynamic resistance. The 100 SMA is safely below the 200 SMA to suggest that the path of least resistance is to the downside.
Sustained gains past the Fibs could test the downtrend’s line in the sand around R3 (196.26) and the longer-term descending trend line, but a break above these levels could point to a reversal from the slide.
Whichever bias you end up trading, don’t forget to practice proper risk management and stay aware of top-tier catalysts that could influence overall market sentiment!
This CHF/JPY setup leans on Fibonacci retracement levels, pivot points, and trend lines to figure out whether the pair is just pulling back or reversing for good, tools you may not be fully comfortable reading yet. Premium members can read our lesson:
📖 How to Identify Reversals and Retracements
Reading this helps you understand how to use Fibonacci levels to spot potential turning points, how pivot points and trend lines add confirmation, and how to tell a temporary correction like this one apart from a genuine trend reversal.
And if you’re not a Premium subscriber yet, now’s a good time to sign up.
With Babypips Premium, you get full access to School of Pipsology lessons that help you understand not just where a chart’s Fib levels and pivot points sit, but how to use them together to judge whether a pullback like CHF/JPY’s is about to reverse or continue.



