





Trend warriors, huddle up!
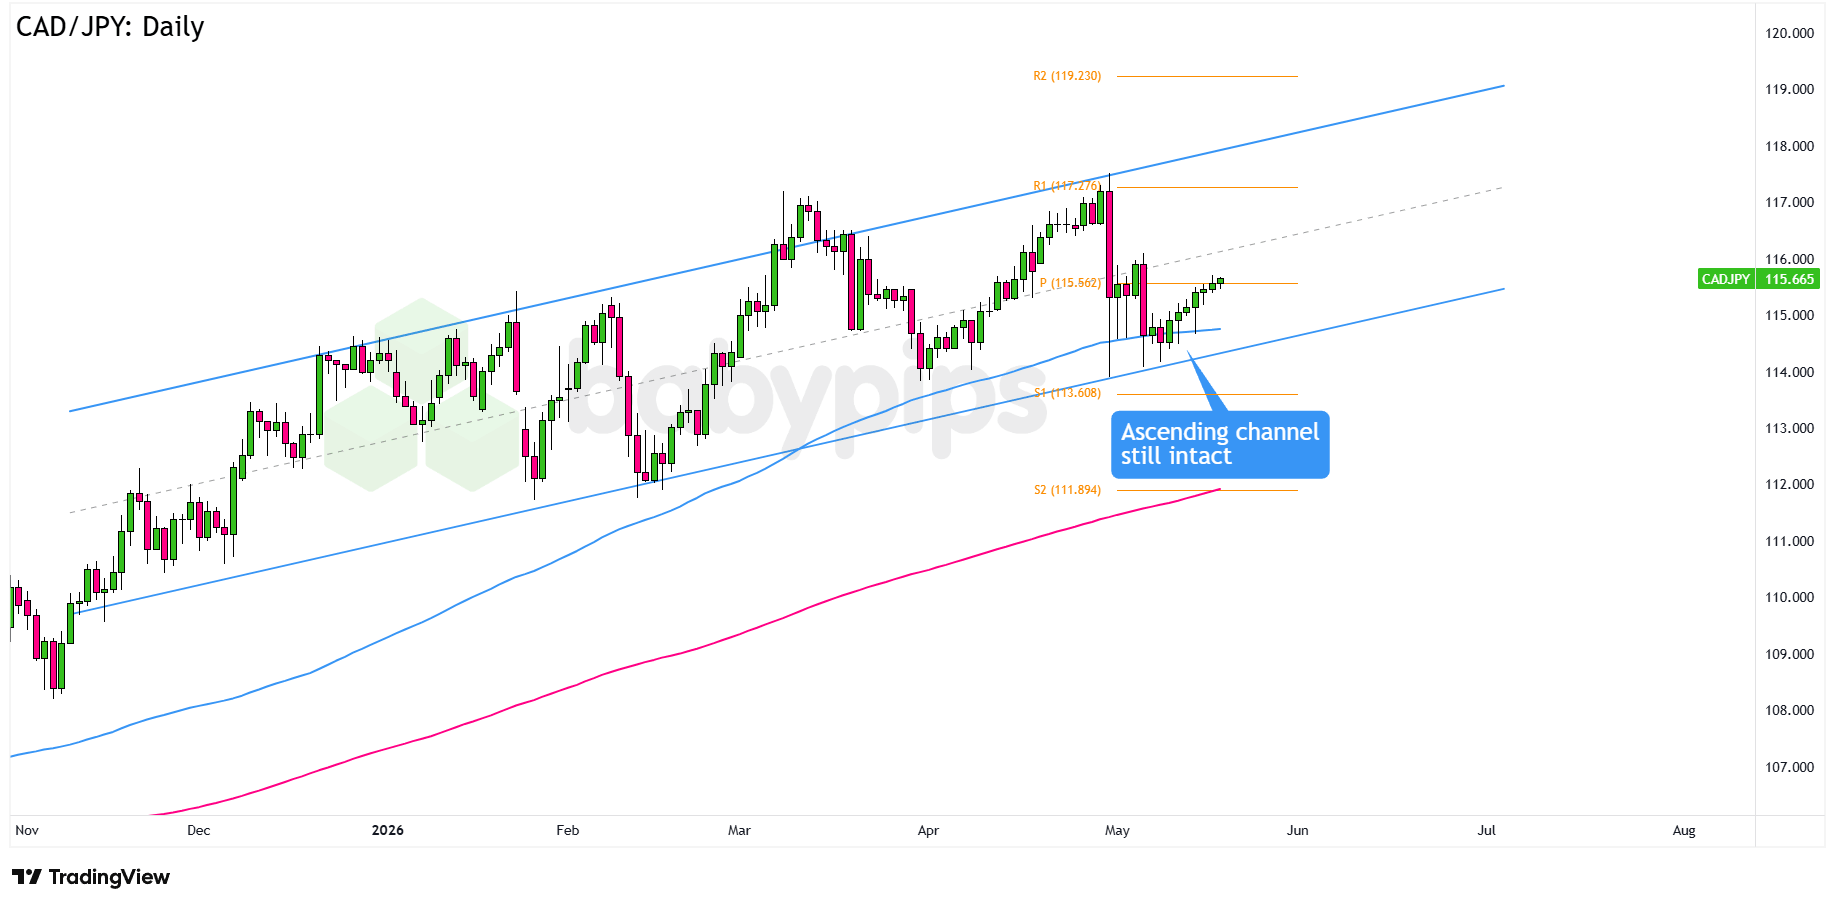
CAD/JPY looks like it just pulled off a solid bounce from a key trend support zone.
Can the bulls keep the comeback going this week? Here’s what we’re seeing on the daily time frame:
CAD/JPY: Daily
CAD/JPY 4-hour Forex Chart Faster With TradingView
The Canadian dollar was last week’s top-performing major currency, helped by better risk sentiment and Canada’s relatively lower exposure to oil supply risks.
The Japanese yen held up pretty well, too, with intervention worries keeping traders from pushing JPY too far in either direction.
CAD/JPY has been making higher highs and higher lows since April last year, and the pair just bounced from the 114.00 area, which also lines up with the bottom of an ascending channel on the daily chart.Remember that directional biases and volatility conditions in market price are typically driven by fundamentals. If you haven’t yet done your homework on the Canadian dollar and the Japanese yen, then it’s time to check out the economic calendar and stay updated on daily fundamental news!
If Loonie bulls stay in control, CAD/JPY could make a run at previous areas of interest like the 116.00 mid-channel zone or even the 117.00 previous highs.
But if sellers defend the Pivot Point at 115.56 or the mid channel area, CAD/JPY could lose steam and slide back toward the 100 SMA or the channel support zone.
Whichever bias you end up trading, don’t forget to practice proper risk management and stay aware of top-tier catalysts that could influence overall market sentiment.
Disclaimer:
Please be aware that the technical analysis content provided herein is for informational and educational purposes only. It should not be construed as trading advice or a suggestion of any specific directional bias. Technical analysis is just one aspect of a comprehensive trading strategy. The technical setups discussed are intended to highlight potential areas of interest that other traders may be observing. Ultimately, all trading decisions, risk management strategies, and their resulting outcomes are the sole responsibility of each individual trader. Please trade responsibly.
This CAD/JPY analysis leans on market structure concepts like higher highs, higher lows, and ascending channel support that not all traders are familiar with. Premium members can read our lesson:
📖 Market Structure: Trends and Ranges
Reading this helps you understand how to identify who’s winning between buyers and sellers, how the sequence of highs and lows defines a trend, and how to read the framework underlying a chart setup like this one.
And if you’re not a Premium subscriber yet, now’s a good time to sign up.
With Babypips Premium, you get full access to School of Pipsology lessons that help you understand not just what the chart is showing, but the market structure principles that explain why the levels and trend direction in setups like this one actually matter.



