





CAD/CHF has formed higher lows and higher highs inside an ascending channel, but it looks like a correction is brewing.
Are Loonie bulls waiting to jump in at pullback levels?
Better keep tabs on these inflection points!
CAD/CHF: 4-hour
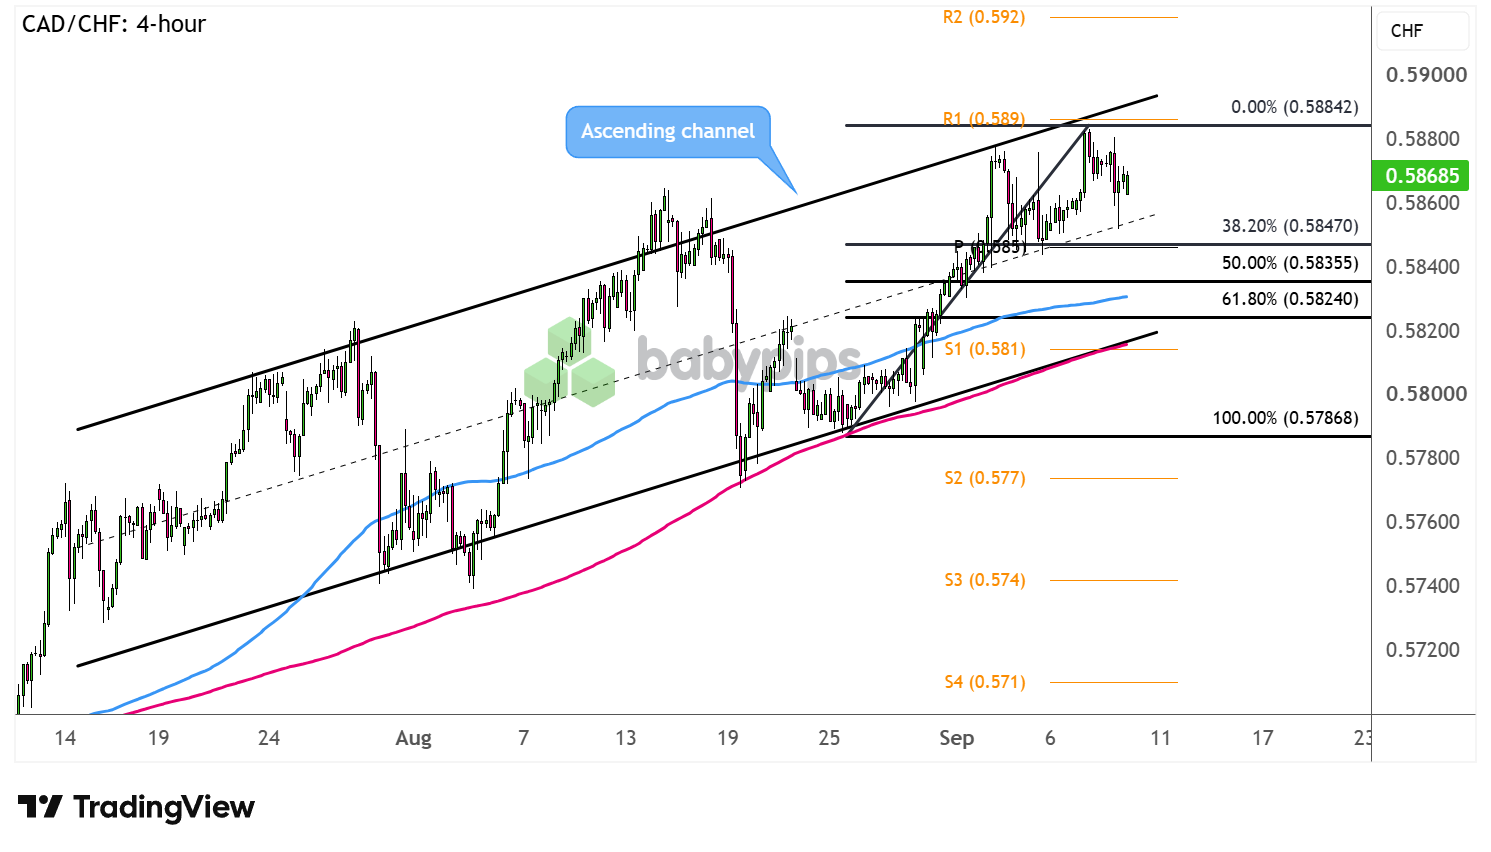
CAD/CHF 4-hour Forex Chart Faster With TradingView
Oil prices have been on a tear lately, lifting the correlated Canadian dollar while geopolitical tensions are once again flaring in the Middle East. The U.S. and Iran have been exchanging one military strike after another, putting the energy commodity’s global supply back in jeopardy.
Though safe-haven flows are also providing some support for the franc, gold weakness appears to be coming in play for the correlated Swiss currency as well.
Is this pair’s uptrend likely to stay intact?
CAD/CHF is pulling back after testing its ascending channel resistance, coming close to the 38.2% Fibonacci retracement level that lines up with the pivot point (.5850) at a minor psychological mark.Remember that directional biases and volatility conditions in market price are typically driven by fundamentals. If you haven’t yet done your homework on the Canadian dollar and the Swiss franc, then it’s time to check out the economic calendar and stay updated on daily fundamental news!
A larger correction could still dip to the 50% Fib near the 100 SMA dynamic support or the 61.8% level around the channel bottom and S1 (.5810).
Keep your eyes peeled for reversal candlesticks at these levels, as a bounce could lift the pair back up to the swing high or channel top at R1 (.5890).
On the other hand, long red candles closing below the channel support could point to a reversal from the uptrend, potentially dragging CAD/CHF to bearish targets at S2 (.5770) then S3 (.5740).
Whichever bias you end up trading, don’t forget to practice proper risk management and stay aware of top-tier catalysts that could influence overall market sentiment.
Disclaimer:
Please be aware that the technical analysis content provided herein is for informational and educational purposes only. It should not be construed as trading advice or a suggestion of any specific directional bias. Technical analysis is just one aspect of a comprehensive trading strategy. The technical setups discussed are intended to highlight potential areas of interest that other traders may be observing. Ultimately, all trading decisions, risk management strategies, and their resulting outcomes are the sole responsibility of each individual trader. Please trade responsibly.
This CAD/CHF setup leans on Fibonacci retracement levels, a pivot point, and the channel trendline together to judge whether the current pullback is just a correction or the start of something bigger, a technique you may not be fully familiar with. Premium members can read our lesson:
📖 How to Identify Reversals and Retracements
Reading this helps you understand how Fibonacci levels, pivot points, and trend lines work together to separate a normal retracement from a full reversal, and why stacking these tools gives you a stronger read than watching the channel alone.
And if you’re not a Premium subscriber yet, consider joining.
With Babypips Premium, you get full access to School of Pipsology lessons that help you understand not just where price sits inside the channel, but how to combine Fibonacci levels, pivot points, and trend lines into one confluence-based read on any pullback.



