





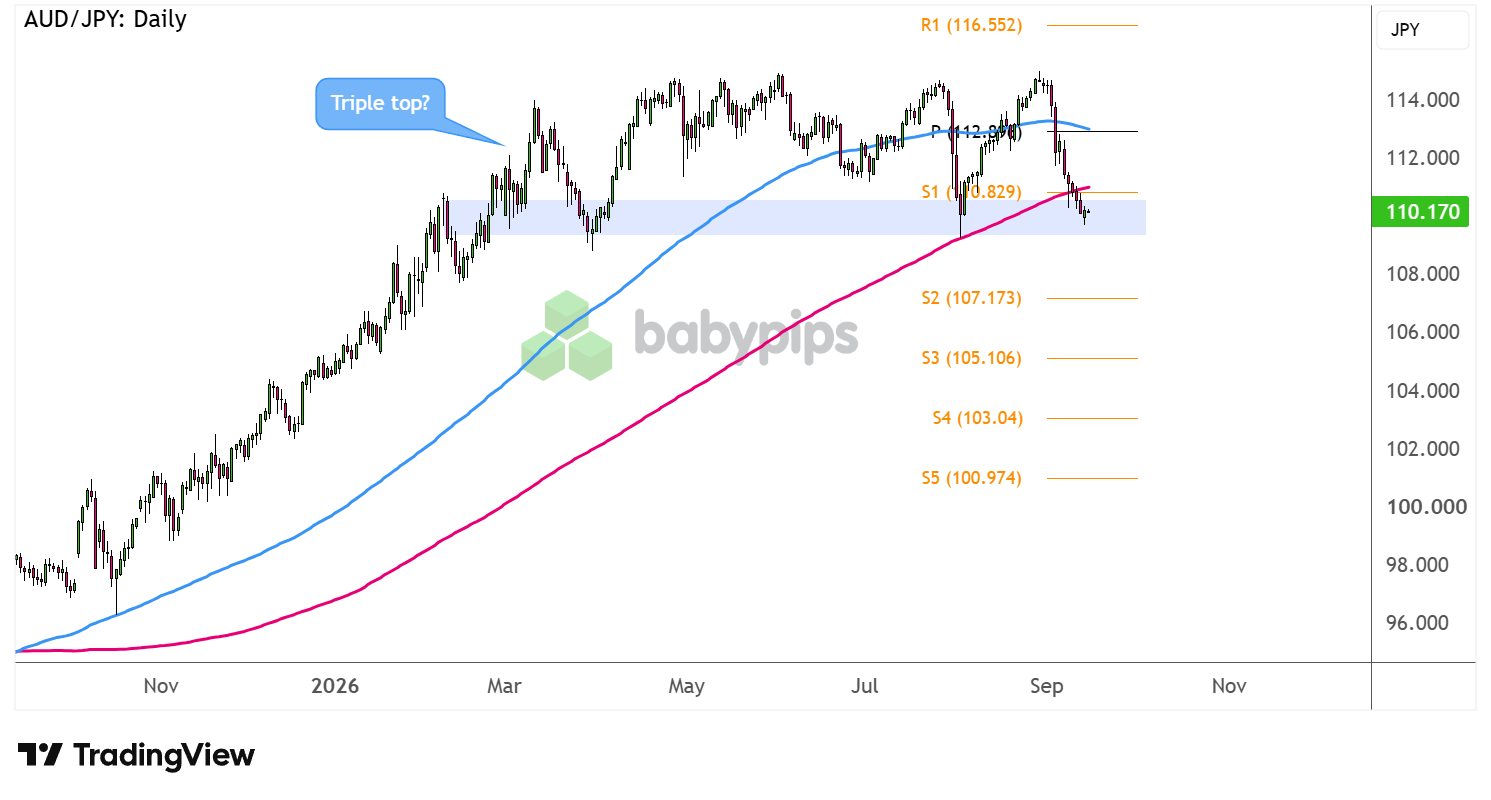
AUD/JPY could be in for a reversal from its months-long uptrend, as the pair has formed a triple top on its daily time frame.
Is it due for a neckline break soon?
Or will Aussie bulls defend the floor once more?
AUD/JPY: Daily
AUD/JPY Daily Forex Chart Faster with TradingView
Expectations of an interest rate hike from the Bank of Japan (BOJ) later this week appear to be driving yen strength, along with safe-haven demand.
After all, risk-off flows appear to be in play so far this week while markets anticipate a Fed rate hike, and Middle East geopolitical tensions remain elevated.
Can these be enough to trigger a neckline breakdown?
AUD/JPY is sitting right on the neckline of the triple top reversal pattern on its daily time frame, already breaking below the 200 SMA dynamic inflection point and possibly eyeing further downside.Remember that directional biases and volatility conditions in market price are typically driven by fundamentals. If you haven’t yet done your fundie homework on the Australian dollar and the Japanese yen, then it’s time to check out the economic calendar and stay updated on daily fundamental news!
A break below the support region around the 110.00 major psychological mark could clear the way for a selloff that’s the same height as the chart formation. Sellers could also target nearby bearish targets at S2 (107.17), then S3 (105.10).
On the other hand, a bounce off the long-term floor could keep AUD/JPY in range, possibly recovering back above S1 (110.82), then testing the pivot point (112.89) or the highs near the 114.00 handle.
Whichever bias you end up trading, don’t forget to practice proper risk management and stay aware of top-tier catalysts that could influence overall market sentiment!
If the term “confluence” in this analysis isn’t entirely clear, or you’re wondering why the overlap of the trend line and 200 SMA matters more than either level alone, Premium members can read our lesson:
📖 Confluence: Stacking the Odds in Your Favor
Reading this helps you understand what confluence means in price action, how stacking multiple technical factors at the same level creates a stronger trade decision zone, and how to evaluate a setup based on how many factors align.
And if you’re not a Premium subscriber yet, now might be a good time to sign up.
With Babypips Premium, you get full access to School of Pipsology lessons that help you understand not just what a chart is showing, but why certain price zones carry more weight than others.



