





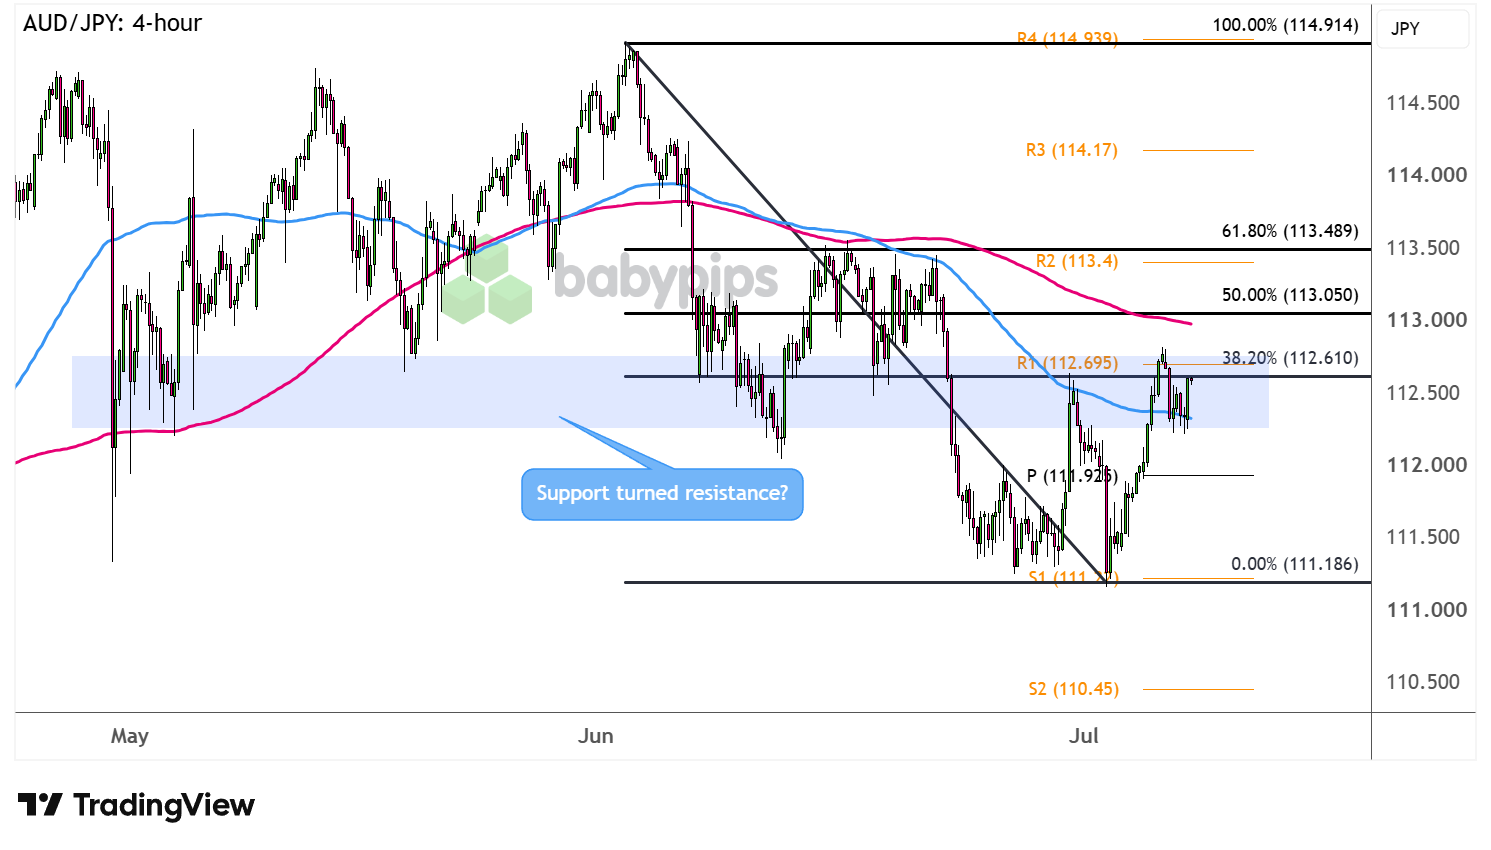
AUD/JPY recently fell through the floor around the 112.50 minor psychological mark and has since pulled up for a retest.
Will the area of interest hold as a ceiling this time?
Check out these potential targets on the 4-hour time frame!
AUD/JPY: 4-hour
AUD/JPY 4-hour Forex Chart Faster with TradingView
Resurfacing geopolitical tensions and the lack of definitive FX intervention efforts from Japanese officials appear to have dragged AUD/JPY well below the 112.50 minor psychological support lately.
However, risk-taking from a strong rebound in AI-related tech stocks and doubts about a hawkish Fed bias are also keeping the higher-yielding AUD afloat.
Which way will AUD/JPY go from here?
The pair is hovering around the 38.2% Fibonacci retracement, which coincides with R1 (112.69), 100 SMA, and the former support area, possibly attracting fresh sellers to sustain the slide.Remember that directional biases and volatility conditions in market price are typically driven by fundamentals. If you haven’t yet done your homework on the Australian dollar and the Japanese yen, then it’s time to check out the economic calendar and stay updated on daily fundamental news!
If so, look out for a continuation of the drop back to the pivot point (111.92) then swing low (111.22). Sustained bearish momentum could even extend the slide all the way down to the next downside target at S2 (110.45).
A larger correction, on the other hand, could still lift AUD/JPY up to the 50% Fib near the 200 SMA dynamic resistance or the 61.8% level close to R3 (113.40).
Keep your eyes peeled for gains past that point, as a return in bullish pressure could take the pair back up to the major resistance near R4 (114.93) and the 115.00 handle.
This AUD/JPY analysis leans on multiple overlapping technical signals to size up a key resistance zone, and if you’re not familiar with how traders use confluence to evaluate those setups, Premium members can read our lesson:
📖 Confluence: Stacking the Odds in Your Favor
Reading this helps you understand how to score a price action setup using confluence, why multiple factors converging at the same level matter more than any single signal in isolation, and how to apply that framework when sizing up a potential breakout or rejection.
And if you’re not a Premium subscriber yet, now’s a good time to sign up.
With Babypips Premium, you get full access to School of Pipsology lessons that help you understand not just where technical signals are converging on the chart, but how to systematically score that confluence before deciding whether a setup is worth trading.



