





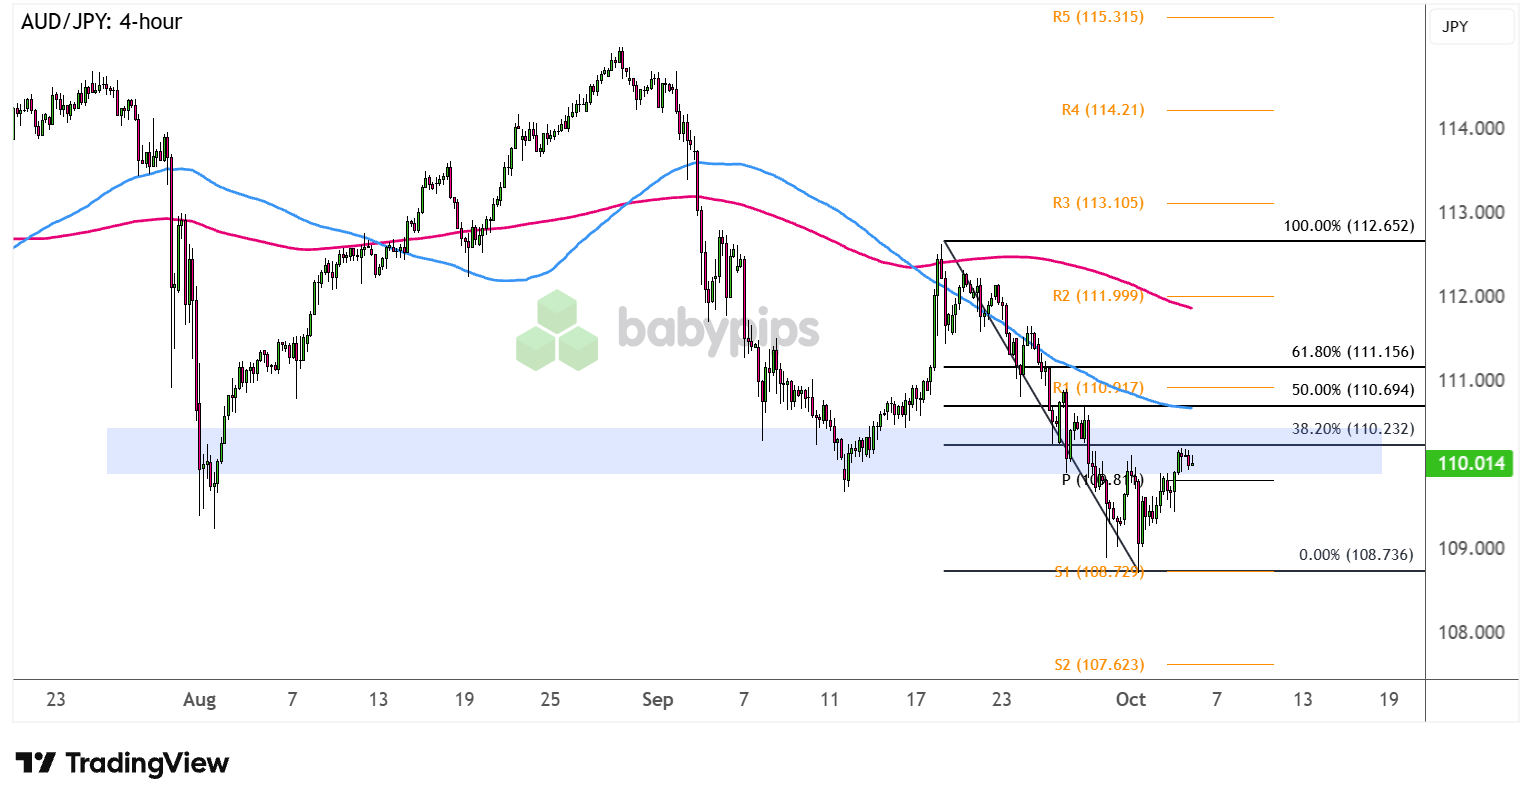
AUD/JPY recently fell through the floor around 110.00 but appears to be pulling back to this area of interest.
Are sellers ready to return?
Check out these retracement levels on the 4-hour time frame!
AUD/JPY: 4-hour
AUD/JPY 4-hour Forex Chart Faster with TradingView
Mostly weaker mid-tier reports appear to be weighing on the Australian dollar so far this week. The MI inflation gauge slowed from 0.5% to 0.3% month-on-month in September, while ANZ job advertisements eased from 2.6% to 2.2% and reflect weakening price pressures and hiring prospects.
Meanwhile, the lower-yielding yen has drawn support from currency jawboning, a hawkish BOJ, and elevated safe-haven flows.
Can AUD/JPY gain more downside momentum on its selloff?
AUD/JPY has pulled up from the swing low near S1 (108.73) to test the 38.2% Fib just above the Pivot Point (109.81). This is also right around the former long-term support, which held as a floor in August and September.Remember that directional biases and volatility conditions in market price are typically driven by fundamentals. If you haven’t yet done your homework on the Australian dollar and the Japanese yen, then it’s time to check out the economic calendar and stay updated on daily fundamental news!
A larger correction could reach the 50% Fib closer to R1 (110.92) and in line with the 100 SMA dynamic resistance, which happens to be below the 200 SMA to confirm bearish pressure.
Look out for reversal candles at any of these potential resistance levels, as a continuation of the slide could drag AUD/JPY to the swing low or to the next downside target at S2 (107.62).
Whichever bias you end up trading, don’t forget to practice proper risk management and stay aware of top-tier catalysts that could influence overall market sentiment!
AUD/JPY is pulling back toward its broken 110.00 floor, and if you’re not sure how Fibonacci levels and pivot points help separate a retracement from a reversal, we’ve got a lesson for that. Premium members can read our lesson:
📖 How to Identify Reversals and Retracements
Reading this helps you understand how Fibonacci retracement levels flag potential resistance, how pivot points and trend lines add confirmation, and how to judge whether a bounce like this one is a pullback within the downtrend or the start of a reversal.
And if you’re not a Premium subscriber yet, consider signing up.
With Babypips Premium, you get full access to School of Pipsology lessons that help you understand not just where the Fib levels sit on the chart, but how to tell whether a pullback is likely to stall or turn into a full reversal.



