





Sun is out, hallelujah.
It’s a brand new trading week, hallelujah.
Or whatever Justin Bieber said.
This week, we’re taking a closer look at AUD/CAD pulling back after making fresh 2026 highs.
How low can the pair go before the bulls step back in? AUD/CAD’s 4-hour chart is flashing some clues!
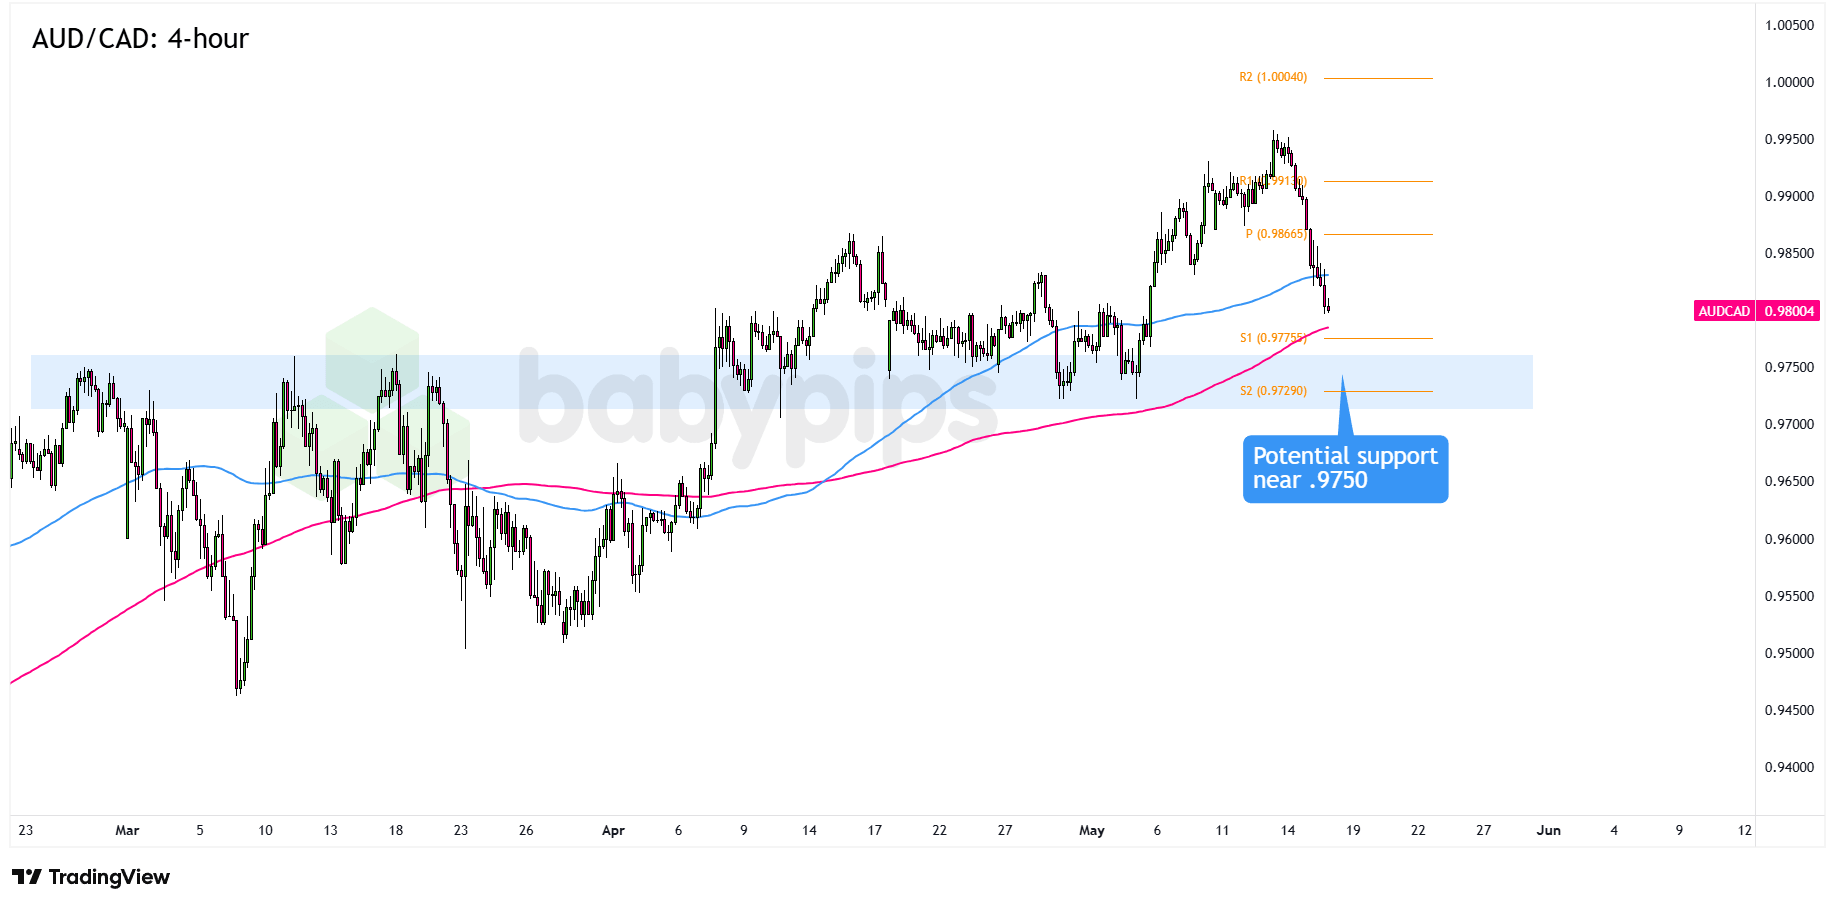
AUD/CAD: 4-hour
AUD/CAD 4-hour Forex Chart Faster with TradingView
The Australian dollar was one of last week’s strongest major currencies, as traders priced in optimism over U.S. China negotiations and the lack of escalation in the U.S. Iran conflict.
The Loonie wasn’t slacking either, as the oil-related currency found support from improved risk sentiment, positive mid-tier data, and relatively less exposure to the oil crisis.
AUD/CAD recently broke out of its April consolidation, but buyers ran into a wall around the .9950 psychological level. The pair has since pulled back toward the .9800 area, putting the focus back on nearby support zones.Remember that directional biases and volatility conditions in market price are typically driven by fundamentals. If you haven’t yet done your homework on the Australian dollar and the Canadian dollar, then it’s time to check out the economic calendar and stay updated on daily fundamental news!
So, where might the bulls step back in?
The .9750 area is worth watching since it lines up with the 4-hour chart’s 200 SMA and the S1 (.9776) Pivot Point line. It also has some history behind it, acting as resistance back in March before turning into solid support in April.
If bullish candlesticks show up around .9750 and the pair holds above the area, AUD/CAD could draw in fresh buying pressure and make another run at the .9950 highs. A stronger bounce could even put fresh 2026 highs on the table.
But if the current pullback keeps going and AUD/CAD starts trading consistently below the S2 (.9729) Pivot Point line, then the bears may stay in control a bit longer. In that case, the pair could slide toward the .9600 area or even revisit the .9550 previous lows.
Whichever bias you end up trading, don’t forget to practice proper risk management and stay aware of top-tier catalysts that could influence overall market sentiment!
AUD/CAD broke out of its April consolidation and is now pulling back toward a key support zone, which is exactly the kind of setup that can trap unprepared traders. Premium members can read our lesson:
📖 The Break-and-Retest: A Higher-Probability Breakout Entry
Reading this helps you understand why waiting for a pullback filters out most fakeouts, what to look for at the retest level before entering, and how to set your stop and target once the level holds.
And if you’re not a Premium subscriber yet, now’s a good time to sign up.
With Babypips Premium, you get full access to School of Pipsology lessons that help you understand not just that a level looks important on a chart, but why breakout retests work, how to read price action signals at the retest zone, and how to build a complete entry plan around them.



