AUD/CAD continues to pace back and forth between support and resistance on its 4-hour time frame.
Will it bounce off the top again soon? Or will we see a break higher this time?
Take a look at these inflection points!
AUD/CAD: 4-hour
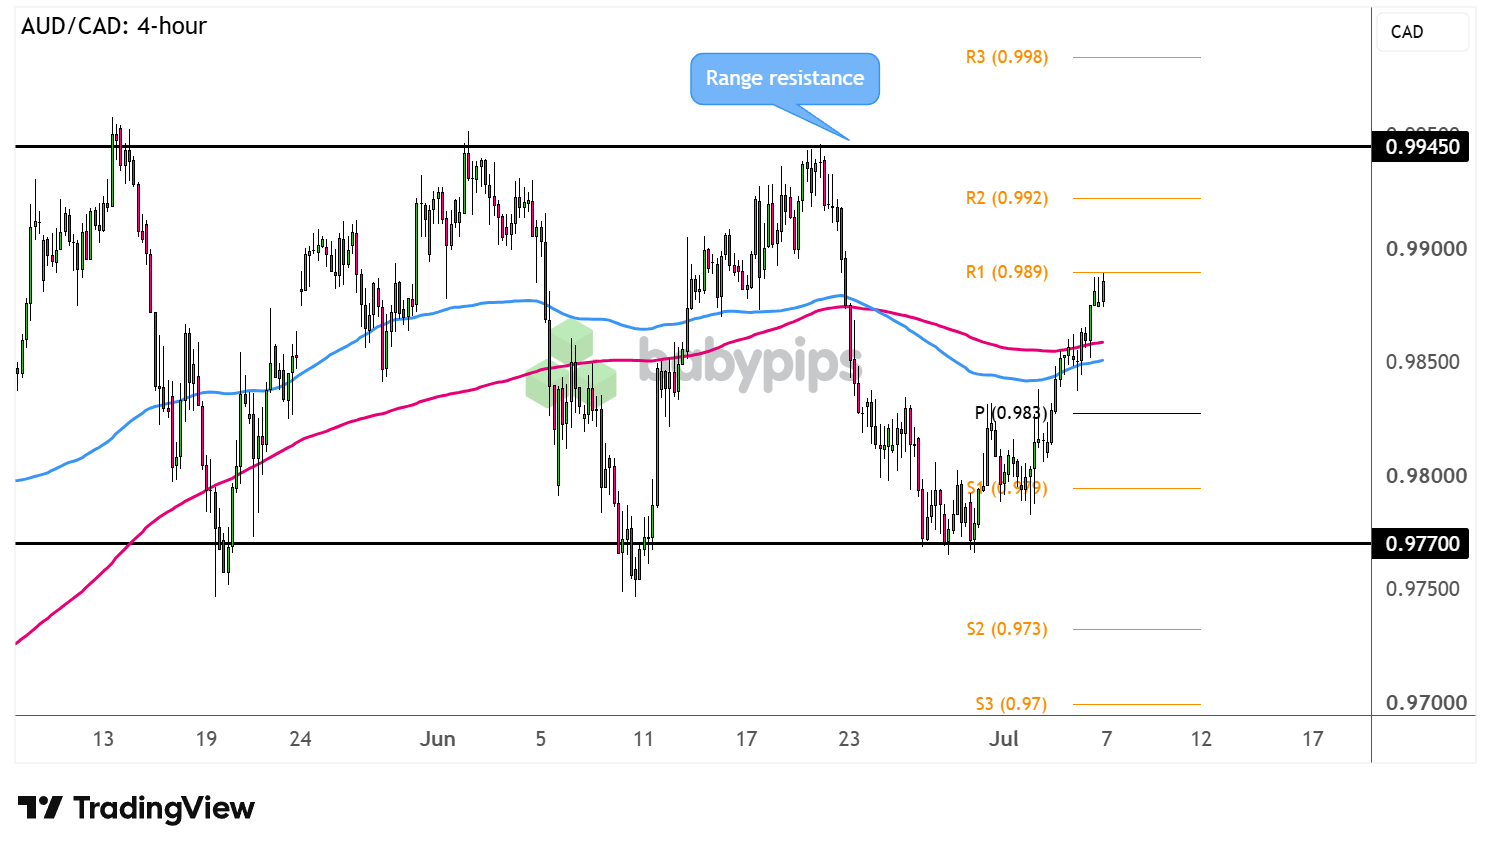
AUD/CAD 4-hour Forex Chart Faster with TradingView
Will this AUD/CAD range keep on giving?
The pair recently bounced off the support zone around the .9770 level and has since busted through near-term inflection points while making its way close to the range resistance at .9945.
Falling oil prices have weighed on the correlated Loonie over the past week, as de-escalation in the Middle East and progress in US-Iran talks have dampened global oil supply concerns.
At the same time, risk-taking has leaned in favor of the Australian dollar thanks partly to the interest rate gap between the Reserve Bank of Australia (RBA) and the Bank of Canada (BOC).
AUD/CAD is now closing in on R1 (.9890) and could still sustain the climb to the next possible ceiling at R2 (.9920). Should any of these resistance levels hold, look out for a move back to nearby bearish targets at the pivot point (.9830) then S1 (.9790).Remember that directional biases and volatility conditions in market price are typically driven by fundamentals. If you haven’t yet done your homework on the Australian dollar and the Canadian dollar, then it’s time to check out the economic calendar and stay updated on daily fundamental news!
Since there are no major reports lined up from both Australia and Canada this week, be sure to keep your eyes and ears peeled for geopolitical headlines that could strongly impact crude oil direction. Signs of resurfacing conflict in the Middle East could revive oil jitters, possibly lifting the oil-related Loonie as well.
Further bearish pressure on oil, on the other hand, could give AUD/CAD a boost past the range resistance and allow buyers to set their sights on upside targets at R3 (.9980) and beyond.
This AUD/CAD analysis leans on multiple overlapping technical signals to size up a key resistance zone, and if you’re not familiar with how traders use confluence to evaluate those setups, Premium members can read our lesson:
📖 Confluence: Stacking the Odds in Your Favor
Reading this helps you understand how to score a price action setup using confluence, why multiple factors converging at the same level matter more than any single signal in isolation, and how to apply that framework when sizing up a potential breakout or rejection.
And if you’re not a Premium subscriber yet, now’s a good time to sign up.
With Babypips Premium, you get full access to School of Pipsology lessons that help you understand not just where technical signals are converging on the chart, but how to systematically score that confluence before deciding whether a setup is worth trading.