





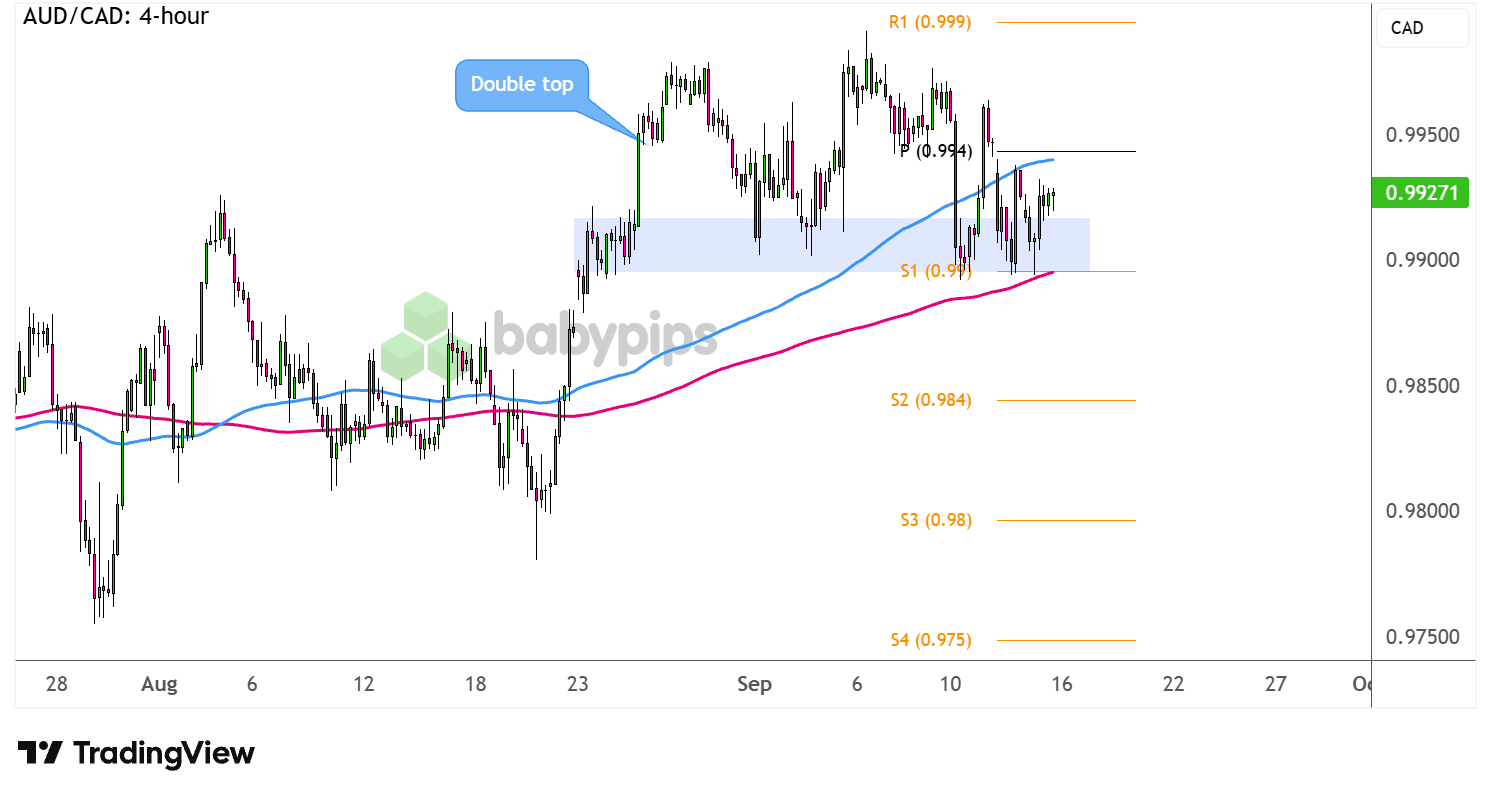
AUD/CAD is hesitating on its climb, as the pair has formed a Double Top on its 4-hour time frame.
Will it find enough bearish momentum for a breakdown soon?
Here are the potential inflection points to watch.
AUD/CAD: 4-hour
AUD/CAD 4-hour Forex Chart Faster with TradingView
Crude oil has been on a tear these days, as elevated geopolitical tensions have driven WTI back above $100 per barrel and lifted the correlated Loonie along with it.
Meanwhile, risk-off flows from the Middle East conflict and caution ahead of the highly anticipated FOMC decision appear to be dragging the Aussie south.
Is AUD/CAD in for a reversal from its recent uptrend?
AUD/CAD is sitting right on the neckline of its Double Top, which happens to line up with S1 (.9900) and a major psychological support.Remember that directional biases and volatility conditions in market price are typically driven by fundamentals. If you haven’t yet done your fundie homework on the Australian dollar and the Canadian dollar, then it’s time to check out the economic calendar and stay updated on daily fundamental news!
A break below the floor could set off a drop that’s the same height as the formation or send the pair down to the next bearish targets at S2 (.9840), then S3 (.9800).
However, it’s also worth noting that the 100 SMA is still above the 200 SMA while the gap between the indicators continues to widen, suggesting that bullish momentum is picking up. Should support still hold, look out for a bounce back up to the highs close to R1 (.9990) or higher.
Whichever bias you end up trading, don’t forget to practice proper risk management and stay aware of top-tier catalysts that could influence overall market sentiment!
This AUD/CAD setup hinges on whether a double top at a key pivot level marks a genuine reversal or just a pause within the uptrend, a distinction you may not be fully equipped to make yet. Premium members can read our lesson:
📖 How to Identify Reversals and Retracements
Reading this helps you understand how pivot points like the S1, S2, and R1 levels in this setup fit into a broader reversal framework, how to cross-check a chart pattern like a double top against trend lines and Fibonacci levels, and how to avoid mistaking a temporary pullback for a full trend change.
And if you’re not a Premium subscriber yet, now’s a good time to sign up.
With Babypips Premium, you get full access to School of Pipsology lessons that help you understand not just where a support or resistance level sits on the chart, but how to tell whether price is about to bounce or break through it for good.



