





Bitcoin could be eyeing more gains, as the OG crypto forms what appears to be a double bottom pattern on the daily time frame.
Take a look at these potential inflection points!
Bitcoin (BTC/USD): Daily
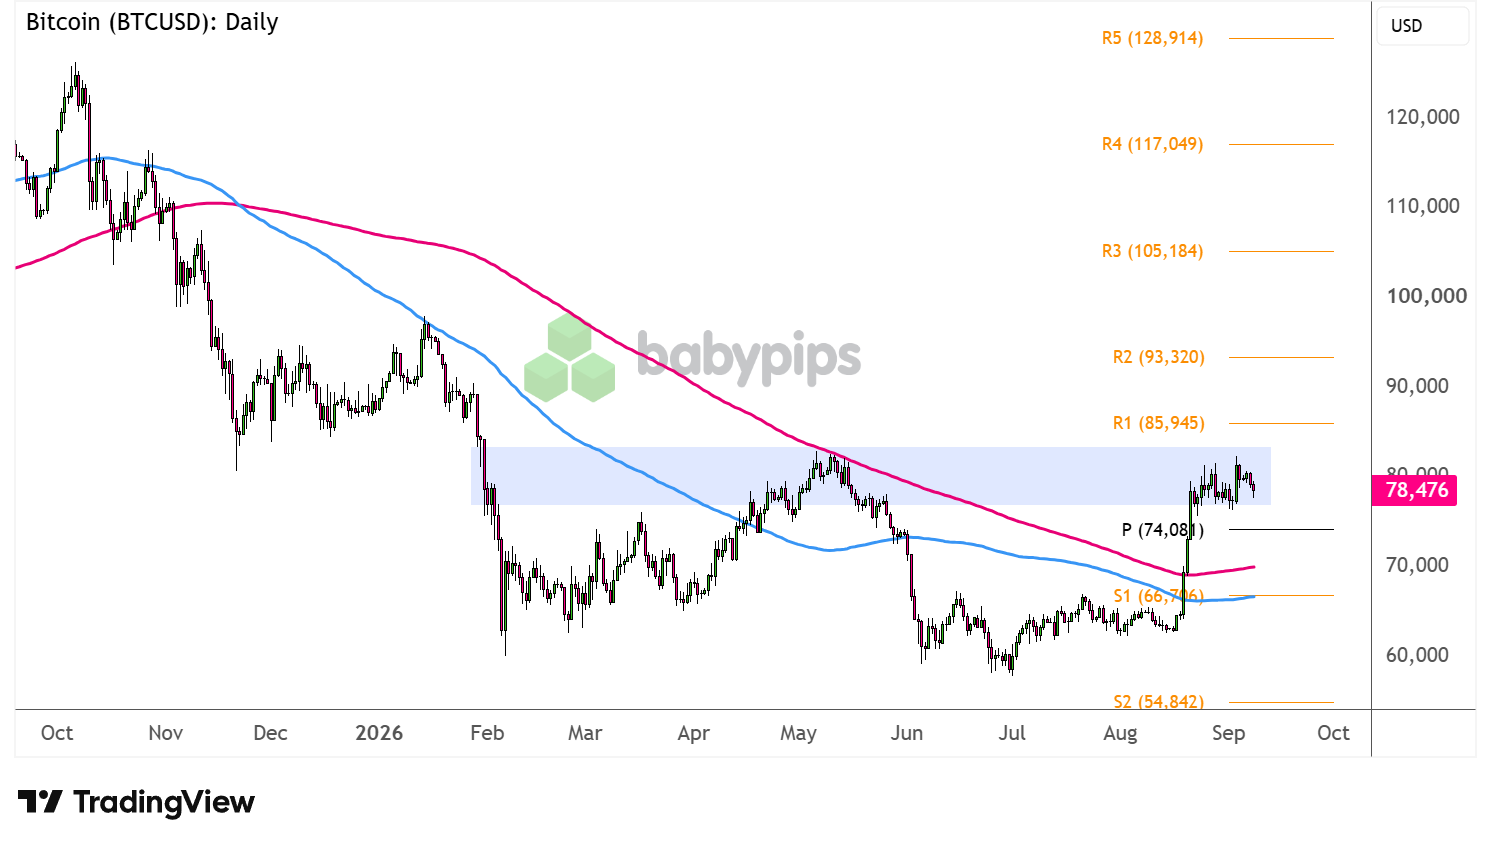
Bitcoin (BTC/USD) Daily Chart Faster With TradingView
Dollar weakness and some risk-taking appear to be propping bitcoin higher so far this week, as price is back to testing the key $80,000 ceiling.
In addition, market caution ahead of the U.S. CPI release during the Fed’s blackout period also seem to be keeping a lid on USD gains.
Can BTC/USD push for a break higher?
Bitcoin happens to be testing the neckline of a double bottom reversal pattern, and a break above this $80K resistance could confirm that a rally is in the works.Remember that directional biases and volatility conditions in market price are typically driven by fundamentals. If you haven’t yet done your homework on Bitcoin and the U.S. dollar, then it’s time to check out the economic calendar and stay updated on daily fundamental news!
Next upside targets to watch out for include R1 ($85,945) then R2 ($93,320) right around the highs at the beginning of this year.
Should resistance hold, on the other hand, look out for another dip to the lows around S1 ($66,786) to the floor near $60K. Don’t forget that the 100 SMA is still below the 200 SMA to reflect bearish pressure, though price has climbed above both moving averages to hint at a possible bullish shift.
Whichever bias you end up trading, don’t forget to practice proper risk management and stay aware of top-tier catalysts that could influence overall market sentiment.
Disclaimer:
Please be aware that the technical analysis content provided herein is for informational and educational purposes only. It should not be construed as trading advice or a suggestion of any specific directional bias. Technical analysis is just one aspect of a comprehensive trading strategy. The technical setups discussed are intended to highlight potential areas of interest that other traders may be observing. Ultimately, all trading decisions, risk management strategies, and their resulting outcomes are the sole responsibility of each individual trader. Please trade responsibly.
This article looks at bitcoin testing the neckline of a double bottom pattern near the $80,000 level, which may be unfamiliar territory if you haven’t studied how key resistance levels form and get tested. Premium members can read our lesson:
📖 Where Breakouts Happen: Mapping the Key Levels
Reading this helps you understand why certain price levels like this $80K ceiling become significant breakout zones, how to rank the strength of a level before a move happens, and why mapping these levels ahead of time helps you judge whether a breakout attempt like BTC’s is likely to hold.
And if you’re not a Premium subscriber yet, now’s a good time to sign up.
With Babypips Premium, you get full access to School of Pipsology lessons that help you understand not just where a chart pattern is forming, but which levels actually matter and how to read whether a breakout attempt is likely to hold or fail.
This content is strictly for informational purposes only and does not constitute as investment advice. Trading any financial market involves risk. Please read our Risk Disclosure to make sure you understand the risks involved.



