





Geopolitical tensions have pushed WTI crude oil back above the $100 per barrel mark lately, but the energy commodity seems to be retreating from its climb.
Will nearby support zones keep the rally intact?
Check out these Fibonacci retracement levels on the 4-hour time frame.
WTI Crude Oil (USOIL): 4-hour
WTI Crude Oil (USOIL) 4-hour Chart Faster with TradingView
The market focus seems to have shifted away from the Middle East conflict lately, as major central bank events have hogged the spotlight while no fresh strikes have been reported, allowing oil to ease from its highs.
In addition, the hawkish Fed hike also stoked strong demand for the U.S. dollar, forcing risk assets like commodities to retreat.
But can crude oil still find buyers soon?
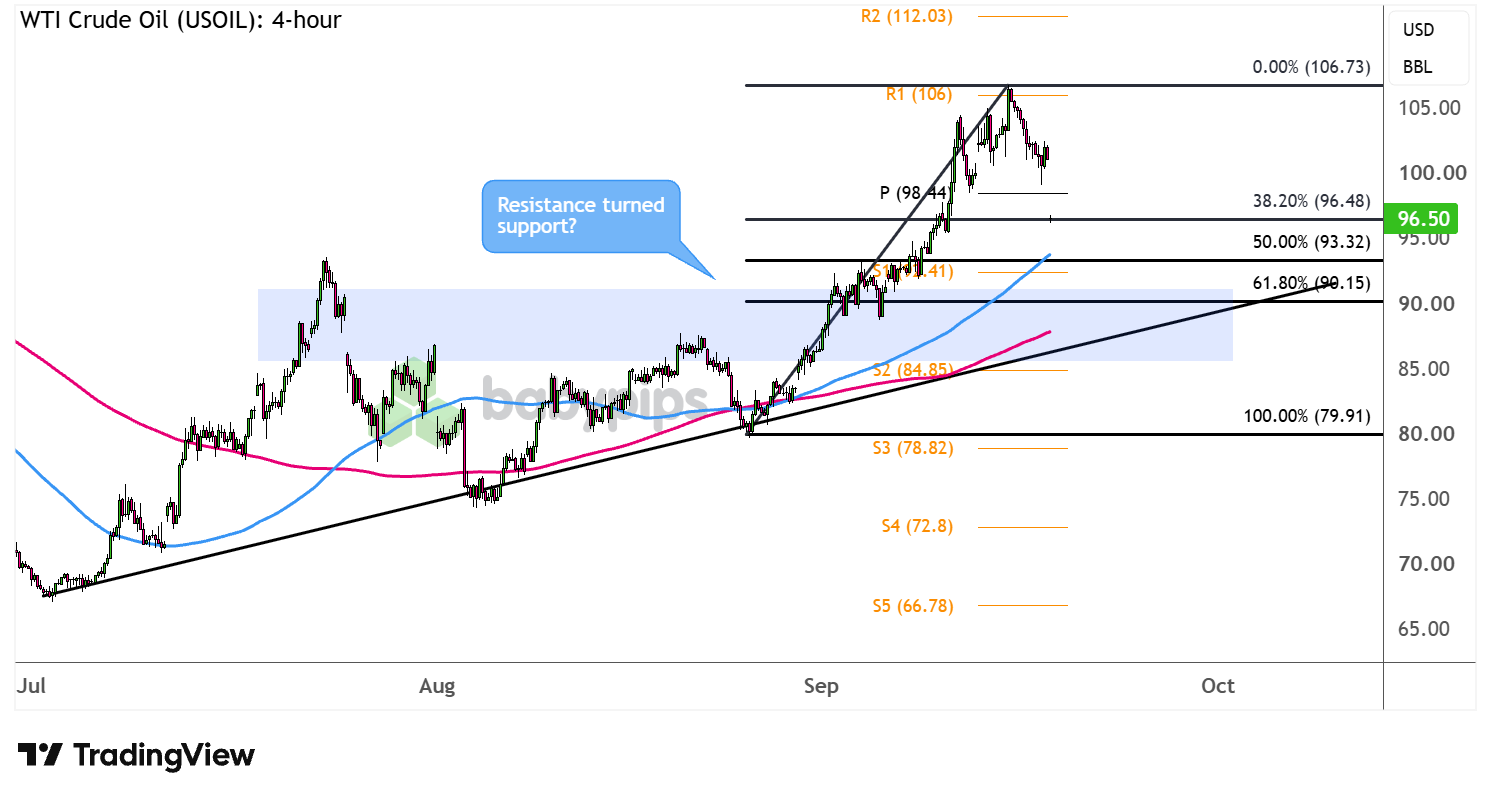
WTI crude oil is pulling back from its recent peak near R1 ($106) to test the $100 per barrel mark just above the pivot point ($98.44).Remember that directional biases and volatility conditions in market price are typically driven by fundamentals. If you haven’t yet done your fundie homework on WTI crude oil and the U.S. dollar, then it’s time to check out the economic calendar and stay updated on daily fundamental news!
A larger correction could still reach the 38.2% Fib at $96.48 or all the way down to the 61.8% level closer to S1 ($92.41) and a rising trend line. This happens to be right around an area of interest or former resistance zone that could hold as support moving forward.
Keep your eyes peeled for reversal candlesticks suggesting a bounce at any of these levels, as a continuation of the climb could take crude oil back up to its latest highs or to fresh bullish targets closer to R2 ($112.03).
On the other hand, long red candles closing below the area of interest and trend line could point to a possible reversal from the uptrend.
Whichever bias you end up trading, don’t forget to practice proper risk management and stay aware of top-tier catalysts that could influence overall market sentiment!
WTI crude oil is pulling back from its highs, and this breakdown leans on Fibonacci levels, a pivot point, and a trend line to gauge whether this is just a retracement or something bigger, tools you may not have used together before. Premium members can read our lesson:
📖 How to Identify Reversals and Retracements
Reading this helps you understand how Fibonacci retracement levels work, how pivot points and trend lines add confirmation, and how to tell whether a pullback like this one is likely to hold as support or turn into a full reversal.
And if you’re not a Premium subscriber yet, consider joining.
With Babypips Premium, you get full access to School of Pipsology lessons that help you understand not just where a chart’s support levels sit, but how to tell the difference between a bounce and a broken trend across any market you trade.



