





Gold staged a sharp recovery from its recent lows, but the upswing may be running into a wall.
Is the rebound already running on borrowed time?
Here’s what we’re seeing on the 4-hour time frame:
Gold (XAU/USD): 4-hour
Gold (XAU/USD) 4-hour Chart Faster with TradingView
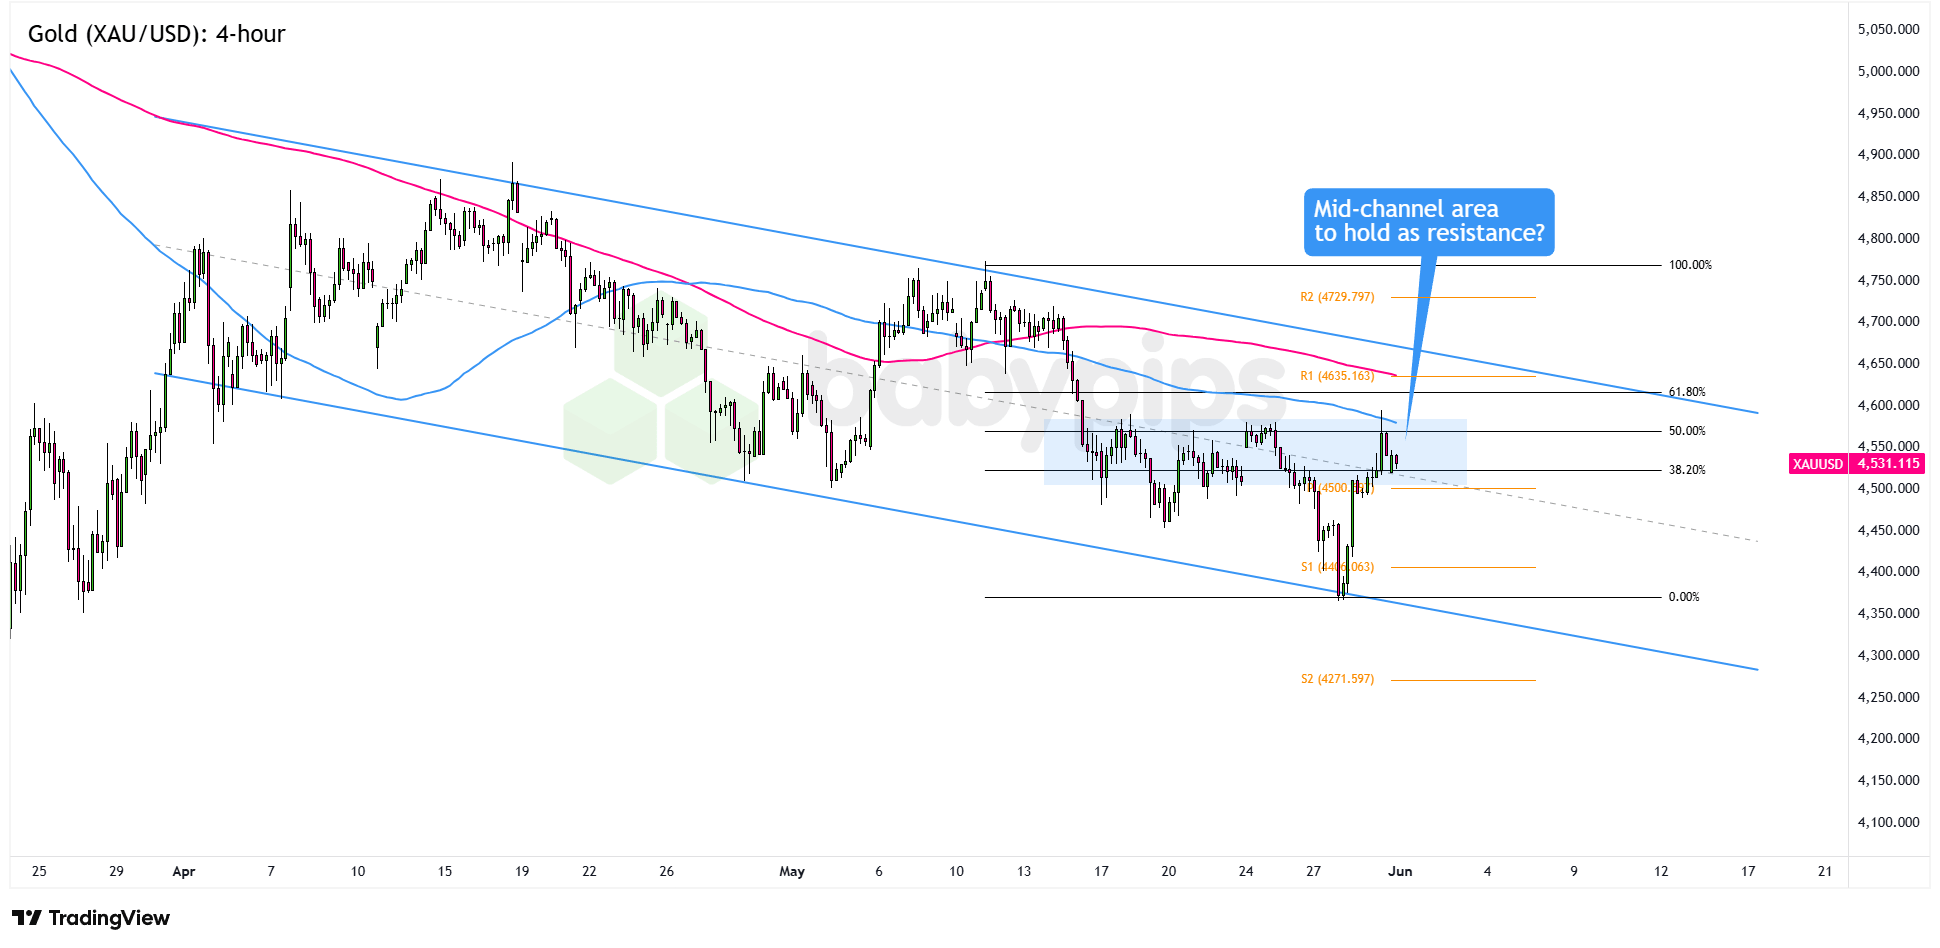
The precious metal has been grinding lower since mid-April, carving out lower highs and lower lows inside a clear descending channel pattern. And as we head into June, that bearish structure is still holding.
Gold has been tracking the dollar more closely than conflict headlines lately, so Friday’s U.S. jobs report could be the main event. A stronger-than-expected labor print could lift the Greenback and drag gold right back to its downtrend lows.
That said, geopolitics still has a seat at the table. The U.S.-Iran ceasefire extension remains unsigned and conditional, so any breakdown in those talks could trigger a sudden safe haven bid and muddy the technical picture.
After sliding to a swing low near $4,400, price has bounced back toward the 38.2%-50.0% Fibonacci retracement zone, roughly between $4,510 and $4,570. That area also lines up with the middle of the channel, a zone where sellers have already stepped in before. In other words, this is where the bears may try to take back control.Remember that directional biases and volatility conditions in market price are typically driven by fundamentals. If you haven’t yet done your homework on gold and the U.S. dollar, then it’s time to check out the economic calendar and stay updated on daily fundamental news!
The 100 SMA has also crossed below the 200 SMA on this time frame, which keeps the bearish bias in play. That kind of crossover tends to keep sellers interested around the same retracement levels price is testing now.
If bears defend the mid-channel area and the 50.0% Fib near $4,550, the next downside target sits at the S1 Pivot Point around $4,400. A close below that could open the door to a deeper drop toward S2 near $4,272.
On the other hand, a sustained daily close above R1 at $4,635 and the channel resistance zone $4,600 would be needed to show that the downtrend is starting to lose steam.
Keep an eye on this week’s top-tier catalysts, too. The ISM Manufacturing PMI kicks things off Monday, while NFP and average hourly earnings land Friday. Either one could give gold a serious shove in both directions.
Whichever bias you end up trading, don’t forget to practice proper risk management and stay aware of top-tier catalysts that could influence overall market sentiment.
Please be aware that the technical analysis content provided herein is for informational and educational purposes only. It should not be construed as trading advice or a suggestion of any specific directional bias. Technical analysis is just one aspect of a comprehensive trading strategy. The technical setups discussed are intended to highlight potential areas of interest that other traders may be observing. Ultimately, all trading decisions, risk management strategies, and their resulting outcomes are the sole responsibility of each individual trader. Please trade responsibly.
Gold is pulling back inside a descending channel, and it can be hard to tell whether price is setting up for a continuation lower or a full trend reversal. Premium members can read our lesson:
📖 Trend Retracement or Reversal?
Reading this helps you understand how to distinguish a retracement from a reversal, what to watch for at key Fibonacci and channel resistance levels, and how to protect yourself when you can’t yet tell which one you’re in.
And if you’re not a Premium subscriber yet, now’s a good time to sign up.
With Babypips Premium, you get full access to School of Pipsology lessons that help you understand not just what the chart is showing, but whether a pullback is a temporary pause in the trend or the start of something bigger.



