How to Trade Wedge Chart Patterns in Forex
Learn how to spot a rising wedge and falling wedge chart patterns like other forex traders.

From basic trading terms to trading jargon, you can find the explanation for a long list of trading terms here.

Find out just how much you've learned by taking any of our 50+ trading quizzes. You can even see how your scores compare to others!

Learn how to trade forex in a fun and easy-to-understand format. Track your progress and learn at your own pace.

In our crypto guides, we explore bitcoin and other popular coins and tokens to help you better navigate the crypto jungle.

Decryptopedia™ helps you decipher crypto jargon back into plain English. Learn the terms that you’ll come across on your crypto journey.

Find out just how much you’ve learned in our School of Crypto by taking our crypto quizzes. How will you score against other quiz takers?

Learn about crypto in a fun and easy-to-understand format. Track your progress and learn at your own pace.

Our Currency Correlation Calculator helps you identify the strength of relationships between currency pairs.


Instantly find out whether the forex market is open or what the current trading session is based on your local timezone.


Our Risk-On/Off Meter helps you gauge risk sentiment of the market & make trades best suitable to the current market conditions.


Determine significant support and resistance levels with the help of pivot points.


Our gain and loss percentage calculator quickly tells you the percentage of your account balance that you have won or lost.


Determine the value per pip in your trading account's currency so you can better manage your risk per trade.


Find the approximate amount of currency units to buy or sell so you can control your maximum risk per position.


Learn how to spot a rising wedge and falling wedge chart patterns like other forex traders.
Learn how forex traders trade symmetrical, ascending, and descending triangle chart patterns.

Improve your forex trading by learning the main groups of chart patterns: reversal, continuation and bilateral.

Learn how forex traders use double tops and double bottoms to trade breakouts.

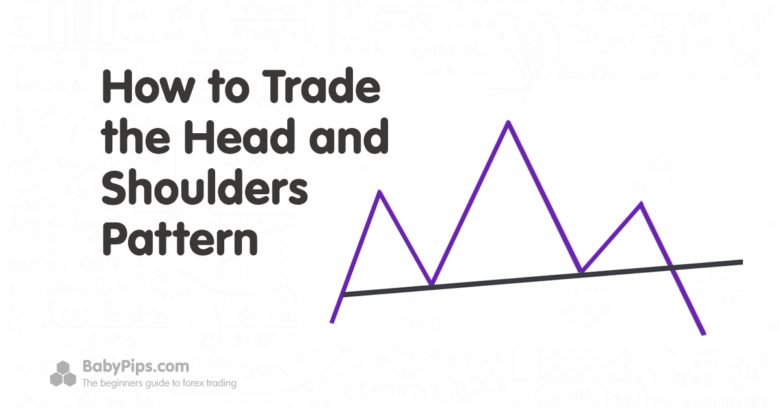
Learn how forex traders use the head and shoulders pattern to spot trend reversals.
Learn is how to calculate forex pivot point levels.

Use this chart patterns cheat sheet to help your trading.

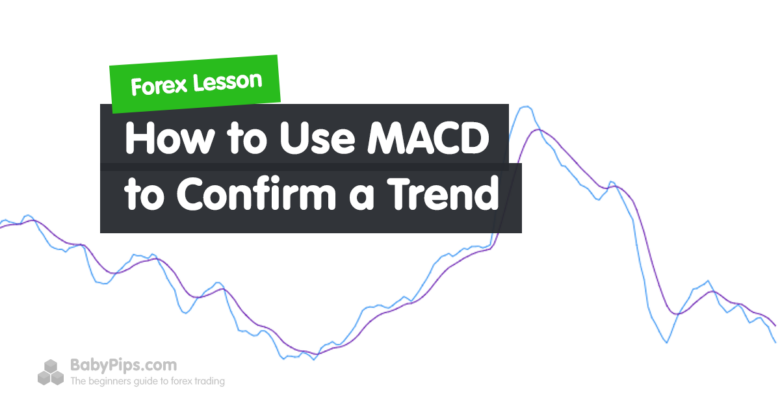
Learn how forex traders use leading and lagging indicators to analyze potential trending and range bound trade opportunities.

Learn how forex traders use the bullish rectangle and bearish rectangle chart pattern to trade breakouts.

In Elliott Wave Theory, learn how the forex market moves against the trend in a 3-wave pattern is called corrective waves.
How do you use Heikin Ashi? Learn how to use and read a Heikin Ashi candlestick chart.

What is a pivot point? And how do traders use pivot points to identify potential reversal points?

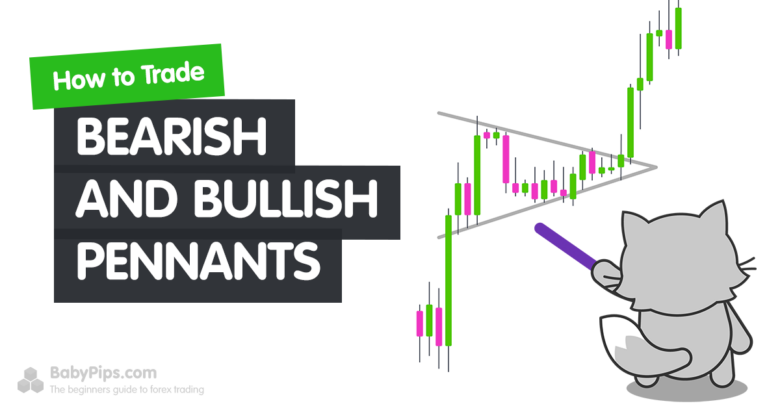
Learn how forex traders use the bearish and bullish pennant chart patterns to trade breakouts.
Elliott Wave is a form of technical analysis based on identifying repetitive price patterns due to underlying crowd psychology based on greed and fear.
Learn how to use Elliott Waves in your forex trading and determine entry, stop loss, and exit points.
Learn how forex traders use leading indicators, also known as oscillators, to alert them of a possible trend reversal.
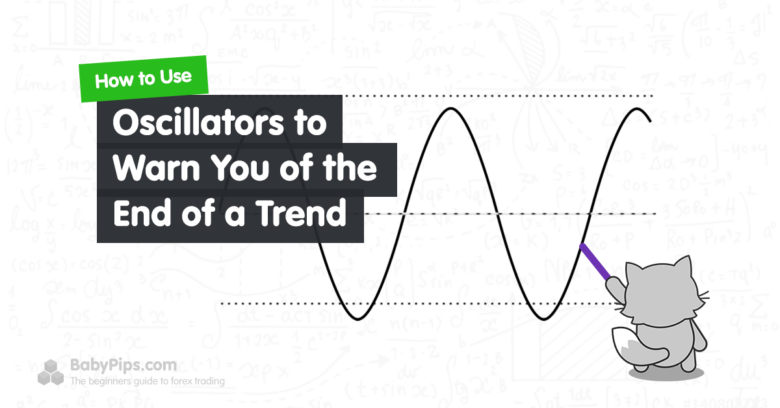
Is the trend you’re in ready to push forward or sputter out?
Learn how forex traders use the Gartley pattern to identify major turning points in the market.
In Elliott Wave Theory, learn how the overall trend in the forex market moves in a 5-wave pattern called impulse waves.
Learn how Heikin Ashi candlesticks are calculated.

Heikin Ashi vs. traditional Japanese candlesticks? Learn the difference between a Heikei Ashi chart versus a traditional Japanese candlestick chart,

In Elliott Wave Theory, learn how each wave is made of sub-waves.
With the Fibonacci retracement tool, making pips can be as easy as A-B-C. Seriously!
Heikin Ashi is great for identifying trend direction and trend strength but it does have some weaknesses and limitations.

Use Heikin Ashi charts? Here’s a cheat sheet of what traders need to remember about Heikin Ashi.

Learn how forex traders use harmonic price patterns to spot possible areas for a continuation of the overall trend.
Learn how forex traders use pivot points to trade breakouts when support or resistance levels fail to hold.

Here are some tips that will help you make better pivot point trading decisions and improve your forex trading.
Here are some tips on applying Elliott Wave Theory principles to your forex trading.
Trading Harmonic Price Patterns is as easy as 1-2-3! Locate the potential price pattern, measure it, and then buy or sell upon its completion!
Education is, after all, a serious business. Its lifeblood is standards. If there are no standards, how do we call something higher education?William J. Bennett