





In a single morning, the U.S. government dropped two massive pieces of data: the updated scorecard for economic growth (GDP) and the Federal Reserve’s absolute favorite inflation gauge (the Core PCE price index).
The tricky part was that growth looked soft, but inflation was still stubbornly high.
Let’s break down what the reports showed, how they could shape the Fed’s next move, and what it all means for your trades.
The GDP Downshift: Muscle vs. Mirage
The Bureau of Economic Analysis (BEA) released its second estimate of Q1 2026 gross domestic product — the revised version, incorporating more complete data on trade, services, and inventories. Real GDP increased at an annualized rate of 1.6% in Q1 2026, down from the 2.0% advance estimate and below the 2.0% market consensus.
A newcomer to macro might see that and think: economy slowing, dollar weakening, sell everything. Not so fast.
The downward revision was almost entirely a technical story. Companies drew down existing inventories faster than they restocked, which mechanically dragged the headline lower. Strip that out and look at real final sales to private domestic purchasers — the “muscle” of the economy, measuring what consumers and businesses are actually spending — and that figure came in at 2.4%, revised down only 0.1 percentage point from the previous estimate.
So, the underlying demand is holding. The headline just looks softer than the reality underneath it.
The Core PCE Thermometer: A Stubborn Flame
 While GDP was doing its inventory shuffle, the April Personal Consumption Expenditures (PCE) report confirmed that price pressures are not going away quietly.
Headline PCE, which includes food, energy, rent, and everything else, rose to 3.8% y/y from 3.5% in March. Part of that jump came from Iran conflict-driven energy prices, which the Fed usually tries to look past.
The real headache is core PCE, which strips out food and energy to show the underlying inflation trend. Core PCE rose to 3.3% year over year in April from 3.2% in March. The Fed wants inflation at 2%, so 3.3% is still way too hot. That’s not a fire that’s almost out. That’s a fire that has decided it pays rent now.
There was one bit of relief. Monthly core PCE came in at 0.2%, softer than the 0.3% forecast.
The Fed’s Dilemma: Trapped in “Higher for Longer”
Put the two reports together and the Fed’s problem gets pretty clear.
If GDP had slowed to 1.6% because Americans stopped spending, the Fed would have a clean case for cuts. But underlying demand is still running at 2.4%, so the economy doesn’t exactly need rescuing. Meanwhile, core PCE at 3.3% means cutting now would be like tossing dry wood onto a fire that refuses to die.
That helps explain why the FOMC has held rates at 3.50% to 3.75% for three straight meetings. April also brought rare disagreement, with three members pushing to remove the easing bias and most officials signaling hikes could become appropriate if inflation stays above 2%.
Markets now see a 57% chance of at least one hike by December, according to CME FedWatch. At the start of 2026, traders were pricing in two or three cuts. Funny what a Strait of Hormuz shock can do.
Then there’s Kevin Warsh. Sworn in as Fed Chair on May 22, Warsh had argued that AI-driven productivity gains could justify easier policy. That case hasn’t aged well. His first FOMC meeting is June 16 to 17, and while Warsh may prefer cuts, his committee is sounding more hawkish. That clash points to policy uncertainty, which usually means choppier currencies and harder to hold trends.
Promoted: Choppy Fed Weeks Need More Than Good Guesses.
Soft GDP, sticky Core PCE, and a divided Fed can turn even solid trade ideas into a stress test. FTMO gives skilled traders access to larger simulated capital, so they can focus on execution instead of forcing big results from a small account.
Learn more about FTMO!
Disclosure: To help support our content, we may earn a commission from our partners if you sign up through our links, at no extra cost to you.
The Dollar’s Divided Reaction
Thursday’s dollar session showed the tug of war in real time. The Greenback gained ground in Asia after Iran launched missiles and drones at Kuwait and a US air base, triggering classic safe haven demand. But softer monthly PCE, along with reports of an Iran ceasefire extension, knocked the dollar back down by the close.
USD Charts: 15-min
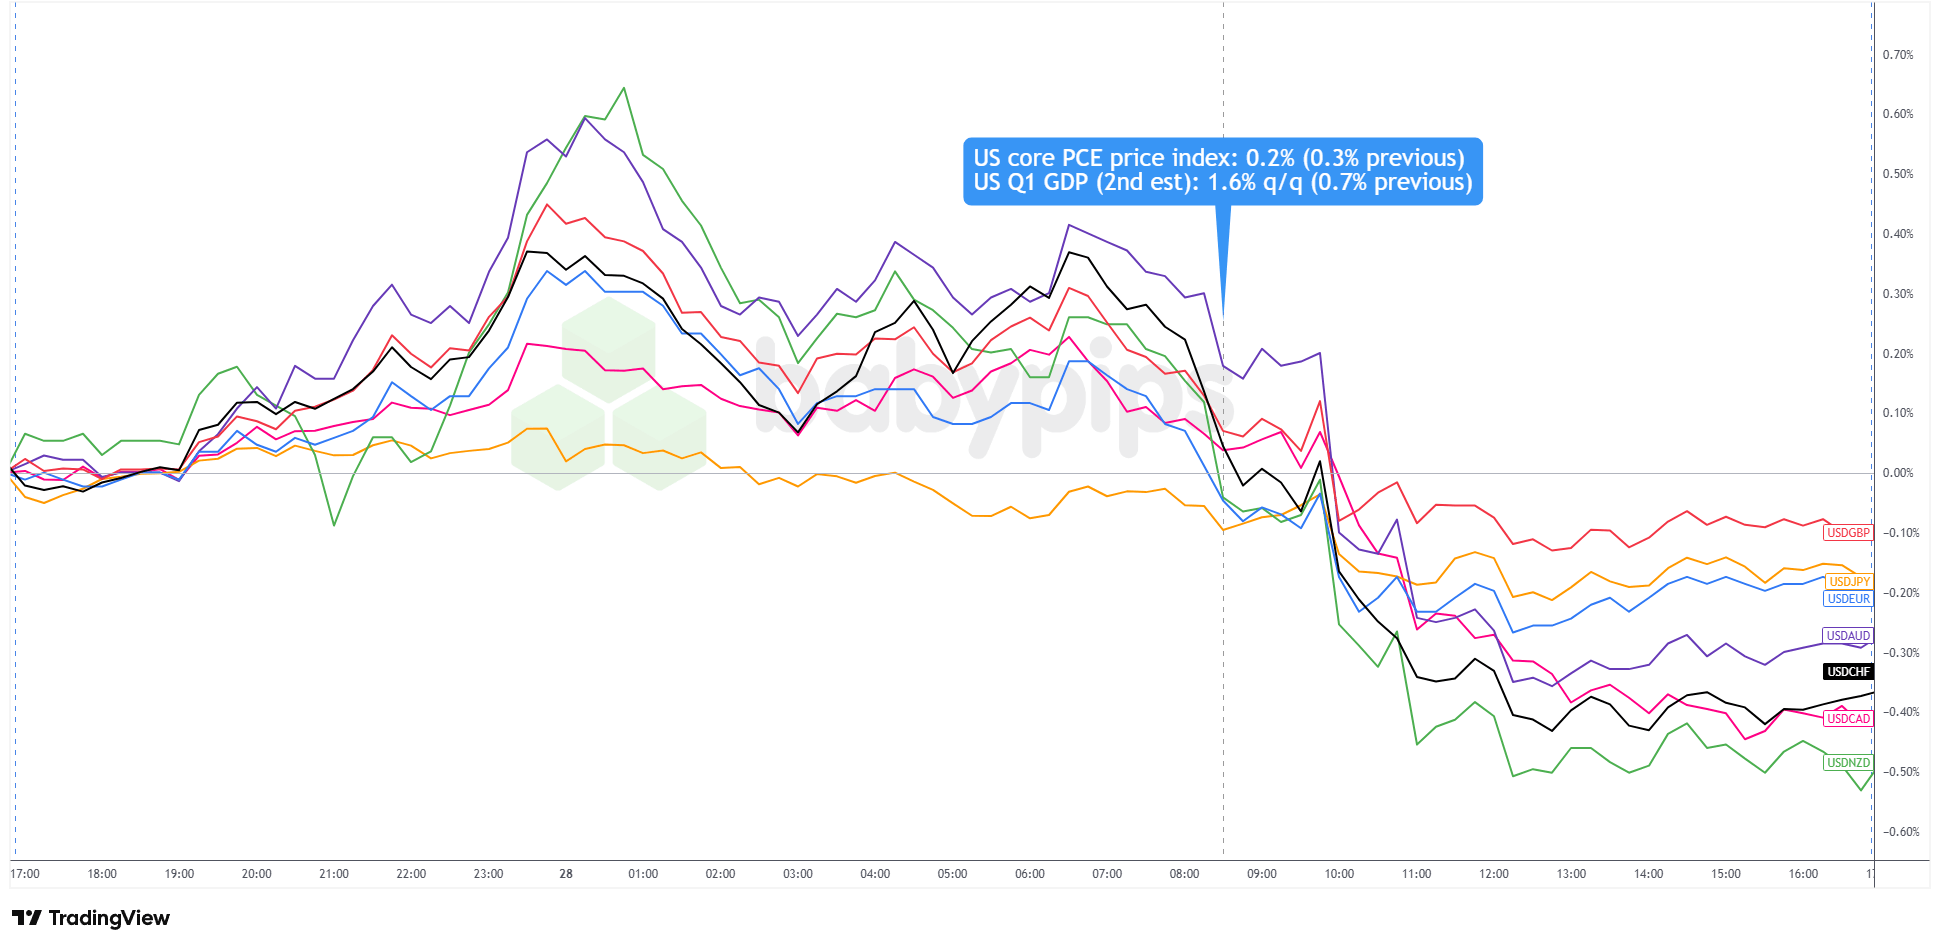
USD 15-Minute Forex – Chart Faster With TradingView
Commodity-linked currencies led the rebound, with AUD, CAD, and NZD benefiting from the improved risk mood. EUR and GBP also firmed, while Treasury yields fell across the curve.
The takeaway is that the dollar was being pulled by three forces at once. Rate expectations matter for EUR/USD and GBP/USD, risk sentiment matters more for AUD, NZD, and CAD, and safe haven demand keeps USD/JPY and USD/CHF tricky.
Quick Takeaways
- Q1 GDP revised to 1.6%, but underlying domestic demand held at 2.4% — the headline looks weaker than the economy actually is.
- April core PCE stuck at 3.3% y/y, well above the Fed’s 2% target; the monthly print of 0.2% was one-tenth softer than forecast, which is what moved markets Thursday.
- The Fed can’t cut — underlying growth doesn’t demand it, and inflation doesn’t permit it. “Higher for longer” is the default setting.
- New Chair Warsh faces his first FOMC test June 16–17. Whether the easing bias is formally dropped — and what he says at the press conference — may move the dollar complex more than the rate decision itself.
- USD weakness on Thursday was broad but uneven: commodity currencies led, EUR and GBP saw some demand, and safe-haven pairs stayed caught in the middle.
What to Watch Next
- June 5 (Thursday): May Non-Farm Payrolls — a hot number reinforces the hike case; a soft one complicates an already divided Fed.
- June 10 (Tuesday): May CPI — the last major inflation print before the FOMC, and likely the deciding input for Warsh’s opening act.
- June 16–17: FOMC decision and Warsh’s first press conference. The statement language matters as much as the rate call itself.
This article digs into the GDP and Core PCE data and what they mean for Fed policy, but if the mechanics of inflation gauges like PCE are unfamiliar, our lesson covers exactly that. Premium members can read our lesson:
📖 Inflation: The Force That Moves Central Banks
Reading this helps you understand how CPI, PCE, and PPI measure inflation, why the Fed targets 2%, and how inflation regimes shape currency values and trading decisions.



