





New Zealand’s unemployment rate rose to 5.6% in the June 2026 quarter, up from a revised 5.4% in March.
Stats NZ’s latest labor market statistics pointed to a labor market that is loosening further despite a headline employment rate that held steady.
The release also highlighted underutilisation — a broader measure of spare capacity in the workforce — jumping to 13.8% from 12.9%, its largest quarterly increase in some time.
Key Takeaways from the Q2 2026 New Zealand Employment Report
- Unemployment rate: 5.6%, up from 5.4% in the March 2026 quarter (revised), and above the prior quarter’s level for a second straight period.
- Underutilisation rate: 13.8%, up from 12.9% — the number of underutilised people rose by 31,000 to 440,000, split roughly evenly between an 8,000 rise in the unemployed and a 9,000 rise in the underemployed.
- Employment rate: unchanged at 66.7%; the number of employed people still edged up by 13,000 to 2,905,000.
- Participation rate: rose to 70.7% from 70.4%, meaning more people entered the labour force even as the jobless queue lengthened.
- Youth unemployment: the number of unemployed 15–24 year-olds rose 19.5% over the year, up 12,200 people.
- Wages were 2.0%, while average hourly earnings rose 2.8% to $44.62 and average weekly earnings for full-time equivalents rose to $1,730 from $1,679.
- Real wages under pressure: with annual CPI inflation running at 4.1%, headline wage growth continues to trail the cost of living.
- Regional and demographic divergence: North Island unemployment climbed to 6.0% from 5.3% a year earlier, versus 3.7% in the South Island; unemployment among Māori (10.8%) and Pacific peoples (11.6%) remains well above the national average.
- Data revisions: Stats NZ corrected processing errors in two HLFS and LCI series covering the December 2025 and March 2026 quarters, which are reflected in this release.
Underemployed workers increased by 9,000 to 154,000, while the “potential labour force” of people not currently counted as unemployed but still available or looking for work grew by 14,000 to 115,000.
Stats NZ noted the broader measure is “just as important as the unemployment rate,” since it gives a fuller picture of spare capacity than the headline figure alone.
Link to official Stats NZ Labor Market Statistics (Q2 2026)
Wage growth remains the RBNZ’s key swing factor. With annual CPI inflation running at 4.1%, the 2.0% rise in the Labour Cost Index means real wages are still going backwards for many households, even as nominal paychecks grow.
Market Reaction
New Zealand Dollar vs. Major Currencies: 5-min
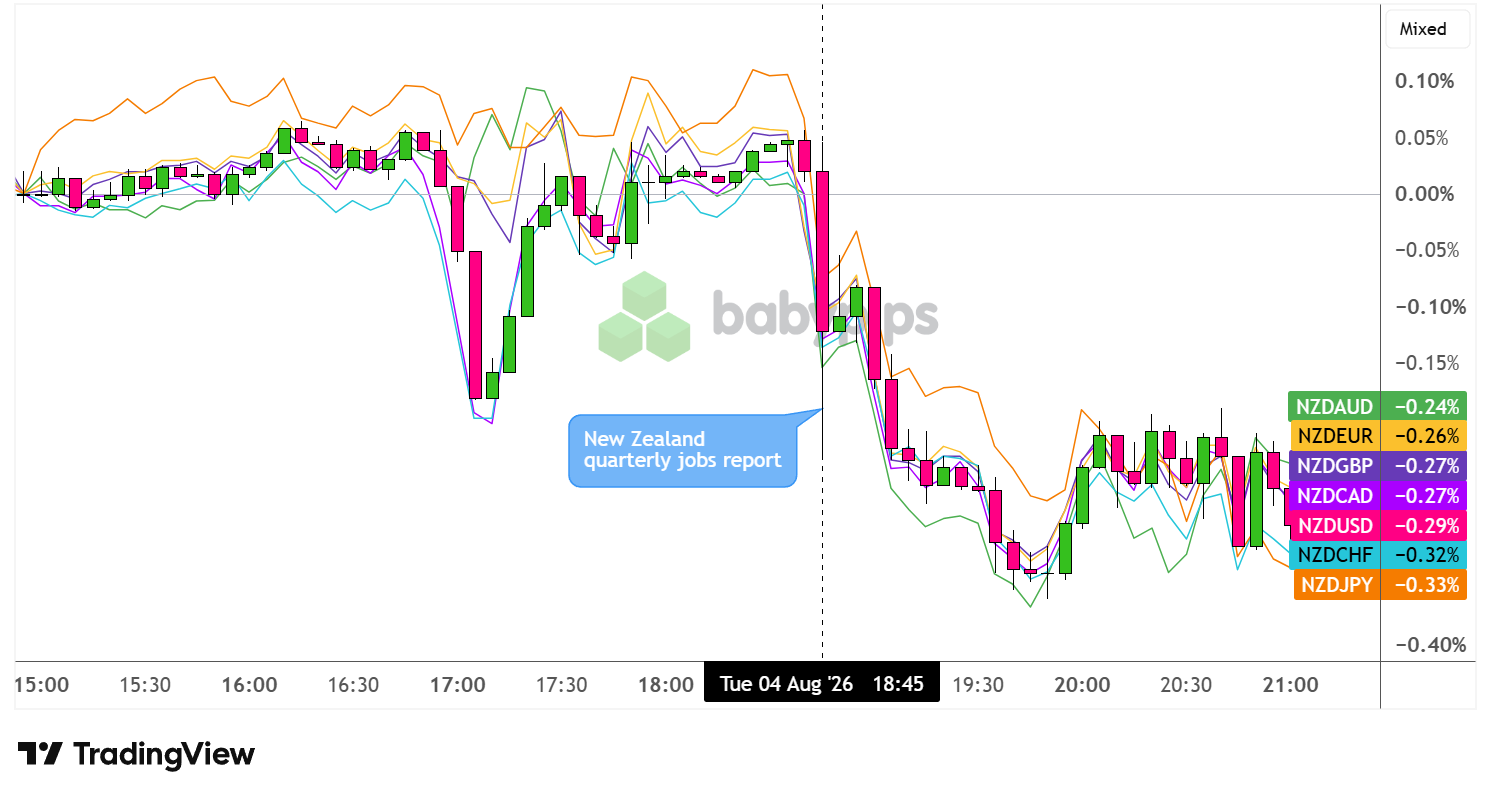
NZD vs. Major Currencies: 5-min Forex Chart Faster with TradingView
The reaction once the report crossed the wires was immediate and one-directional. NZD dropped sharply across every major pair within minutes of the release and, unlike a typical knee-jerk move that fades, the decline extended over the following hour rather than reversing.
By the end of the session, NZD was down across the board, off roughly 0.24% to 0.33% against all seven majors tracked.
Losses were steepest against the yen (-0.33%) and Swiss franc (-0.32%) and comparatively more contained against the Australian dollar (-0.24%). NZD also fell against the US dollar (-0.29%), euro (-0.26%), pound (-0.27%), and Canadian dollar (-0.27%).
New Zealand’s jump in unemployment and underutilisation triggered a sharp, sustained drop in the kiwi, and you may not be familiar with why the move kept extending instead of fading. Premium members can read our lesson:
📖 From Data to Price Action: What Happens When Big News Hits
Reading this helps you understand why the initial algorithmic spike after a data release often gives way to a second, more analytical move, how traders weigh a weak headline number against the broader picture like underutilisation and wage data, and what separates a fade-prone knee-jerk reaction from a trend that holds.
And if you’re not a Premium subscriber yet, now’s a good time to sign up.
With Babypips Premium, you get full access to School of Pipsology lessons that help you understand not just that a weak jobs report sent the kiwi lower, but the full mechanics of how a data surprise turns into a sustained, multi-hour move across every major pair.



