





The ISM Manufacturing Purchasing Managers’ Index (PMI) came in at 54.5, just below the 54.7 forecast, so markets initially had little reason to react.
But the real surprise was buried one line lower, where the Prices Paid component jumped well above forecast.
Within an hour, the 10-year Treasury yield was pushing toward levels not seen since 2002, while the dollar climbed against most major currencies, all because of a component many new traders don’t even know to watch.
What Is the ISM Manufacturing PMI, Actually?
Each month, the Institute for Supply Management surveys roughly 400 supply executives at U.S. manufacturing companies, asking whether business conditions improved, stayed the same, or worsened from the previous month.
Those responses are then used to create a diffusion index, which runs from 0 to 100, with readings above 50 pointing to expansion and readings below 50 signaling contraction.
September’s headline PMI came in at 54.5, marking a ninth straight month of expansion. It was a solid but unremarkable reading, or the kind of number traders might glance at before moving on.
But here’s what newer traders often miss. The headline PMI is based on only five components: New Orders, Production, Employment, Supplier Deliveries, and Inventories.
Prices Paid is tracked separately and doesn’t factor into the headline reading at all, but when it delivers a big surprise, markets can react as though it’s the most important number in the report.
Promoted: Stay Ready When Market Volatility Hits.
A surprise like the ISM Prices Paid spike can send yields and currencies moving fast. ForexVPS provides reliable uptime and low latency execution, helping your automated strategies stay connected when every second counts.
Explore VPS plans at ForexVPS!
Disclosure: To help support our free daily content, we may earn a commission from our partners if you sign up through our links, at no extra cost to you.
So Why Did the Prices Number Hit Harder Than the Headline?
The Prices Paid index tracks what manufacturers are currently paying for raw materials, so a sharp increase points to rising costs throughout the supply chain. Those costs rarely stay inside the factory for long, as companies often pass at least some of the increase along to their customers.
September’s reading climbed to 77.9%, up 6.8 percentage points from August’s 71.1%. The index was also back near the 78.3% level recorded in March 2026, when the Iran War began, which isn’t exactly a comforting comparison for anyone hoping inflation is cooling.
Two pressures appear to be working at the same time. Tariffs were mentioned in roughly 34% of negative respondent comments, particularly in connection with imported steel, aluminum, and cross-border components. Energy costs appeared in around 30% of the comments, as the conflict in the Middle East pushed petroleum-based input prices higher across the board.
Neither pressure is new, but both intensified in September.
Here’s the chain reaction traders need to understand: Higher factory costs tend to move through the economy, appearing first in the PPI (Producer Price Index) before reaching the CPI (Consumer Price Index) and PCE (Personal Consumption Expenditures). Since PCE is the Federal Reserve’s preferred inflation gauge, rising input costs can shift monetary policy expectations before those pressures reach consumer data.
Other parts of the report reinforced that warning. Supplier Deliveries rose to 59.0%, signaling slower deliveries for a tenth straight month, while Customers’ Inventories fell to 41.6%, suggesting customers are carrying relatively lean inventories.
The combination can keep prices elevated, so when Prices Paid came in 6.6 points above the 71.3% forecast, markets began questioning whether inflation was cooling as steadily as recent CPI and PCE readings had suggested.
How Did Bond Yields and the Dollar Respond?
Higher factory costs could eventually reach consumers and make Federal Reserve rate cuts less likely, prompting traders to sell Treasuries and pushing bond yields, or the effective interest rate on government debt, higher.
Shortly after the U.S. ISM PMI release, the 10-year Treasury yield had climbed toward 5.34%, its highest level since 2002. Those higher yields made dollar-denominated assets more attractive than assets in lower-yielding currencies, drawing capital toward the U.S. and supporting the dollar’s broad rally.
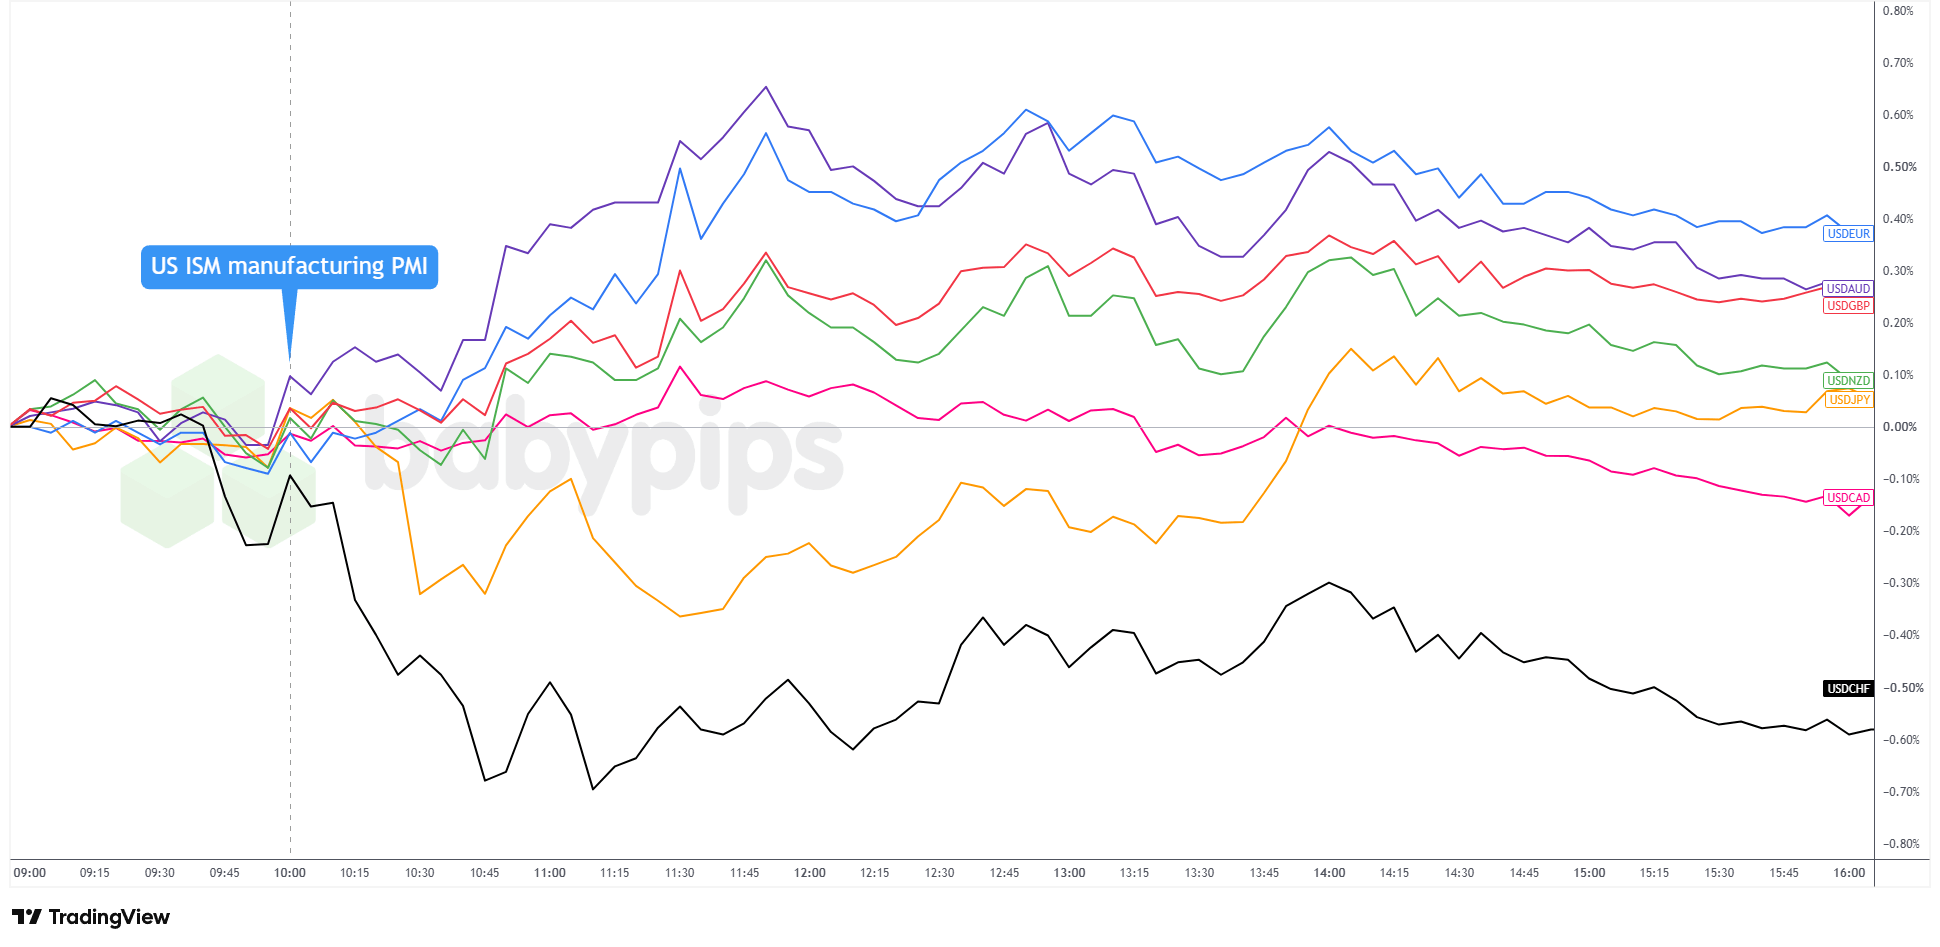
USD 5-minute Forex Charts – Chart Faster with TradingView
The Swiss franc moved in the opposite direction, likely as demand for safe havens appeared to outweigh the dollar’s yield advantage. The yen was also pulled in both directions as safe haven demand competed with rising U.S. yields, although the dollar gradually regained the upper hand as Treasury yields remained elevated.
By day’s end, the U.S. dollar was in the green against the majors except against the Loonie and franc.
The takeaway is that an inflation surprise can move the dollar broadly without affecting every currency pair the same way. Currencies with their own safe haven appeal or strong links to commodities can move against the broader trend, sometimes by a considerable margin.
The Bottom Line
First, the headline ISM PMI is only a starting point and doesn’t tell the whole story. Second, the Prices Paid index is where the inflation warning is flashing right now, with the 77.9% reading showing that manufacturers are facing higher costs across a wide range of inputs.
Since those costs can reach consumers within a few months, bond traders didn’t wait for the next CPI or PCE report before repricing the outlook.
That’s why the 10-year Treasury yield climbed to a 24-year high. For forex traders, higher U.S. yields will generally support the dollar against currencies offering lower returns, although safe haven demand and commodity price moves can still send individual pairs in a different direction.
What to Watch Next
The September U.S. jobs report arrives today at 12:30 GMT, with economists expecting around 89,000 new payrolls. A strong report following Thursday’s Prices Paid surprise would make the case for keeping rates higher for longer even harder to dismiss.
The Euro Area flash CPI for September is also due today at 9:00 a.m. GMT, while the next ISM Manufacturing PMI, covering October, will be released on November 2, 2026.
This article traces how a Prices Paid surprise pushed 10-year Treasury yields to a 24-year high and drove a broad dollar rally, and if the link between rising yields and currency moves isn’t fully clear, Premium members can read our lesson:
📖 How Bond Yields Affect Currency Movements
Reading this helps you understand why rising bond yields attract foreign capital to dollar-denominated assets, how yield differentials between countries drive exchange rates, and why Thursday’s FX reaction started in the bond market before it showed up on your currency chart.
And if you’re not a Premium subscriber yet, now’s a good time to sign up.
With Babypips Premium, you get full access to School of Pipsology lessons that help you understand not just how currencies move, but why the bond market is often the first place that signals where the dollar is headed.



