


New Zealand’s unemployment rate ticked down to 5.3% in the March 2026 quarter, slightly better than the 5.4% consensus and right in line with the Reserve Bank of New Zealand’s (RBNZ) own forecast.
However, this wasn’t exactly a “pop the champagne” labor report. Employment was softer and wage growth stayed muted, keeping the broader picture of a still loose labor market intact.
Key Takeaways
- Unemployment rate fell to 5.3% from 5.4% (q/q), up 0.2 percentage points (y/y)
- Employment change came in at +0.2% (q/q), missing the 0.3% forecast and slowing from +0.5% prior
- Participation rate edged down to 70.4% from 70.5%; employment rate held steady at 66.7%
- Underutilisation rate unchanged at 12.9%, with 406,000 people underutilised
- Private sector LCI up 0.4% (q/q) and 2.0% (y/y); public sector wages up 1.7% (y/y)
- All-sector wage growth running at 2.0% (y/y) — well below annual CPI of 3.1%
Link to official Stats NZ Labour Market Statistics (Q1 2026)
Employment rose just 0.2% for the quarter, missing expectations and slowing from the previous quarter’s 0.5% gain. Even worse, part of the drop in unemployment came from a small pullback in the participation rate. This basically meant that the jobless rate improved partly because fewer people were counted in the labor force, not because hiring suddenly took off.
That matters because businesses are still cautious. Hiring is slower, pay growth is barely moving, and there’s still plenty of spare capacity in the labor market. Underutilization held at 12.9%, which means there are still a lot of people who are unemployed, underemployed, or available to work but not fully counted in the headline unemployment rate.
For the RBNZ, the wage numbers may be the bigger deal. The Labour Cost Index held at 2.0% annually, well below the 3.1% CPI reading for the same period. That suggests labor costs aren’t adding much fuel to the inflation fire, at least not yet.
The catch is that Q1 may not show the full hit from the U.S.-Iran conflict. Economists warned that the employment impact could take another six to twelve months to show up, so this report is more of a “so far, so okay” reading than an all-clear signal.
Market Reactions
New Zealand Dollar vs. Major Currencies: 5-min
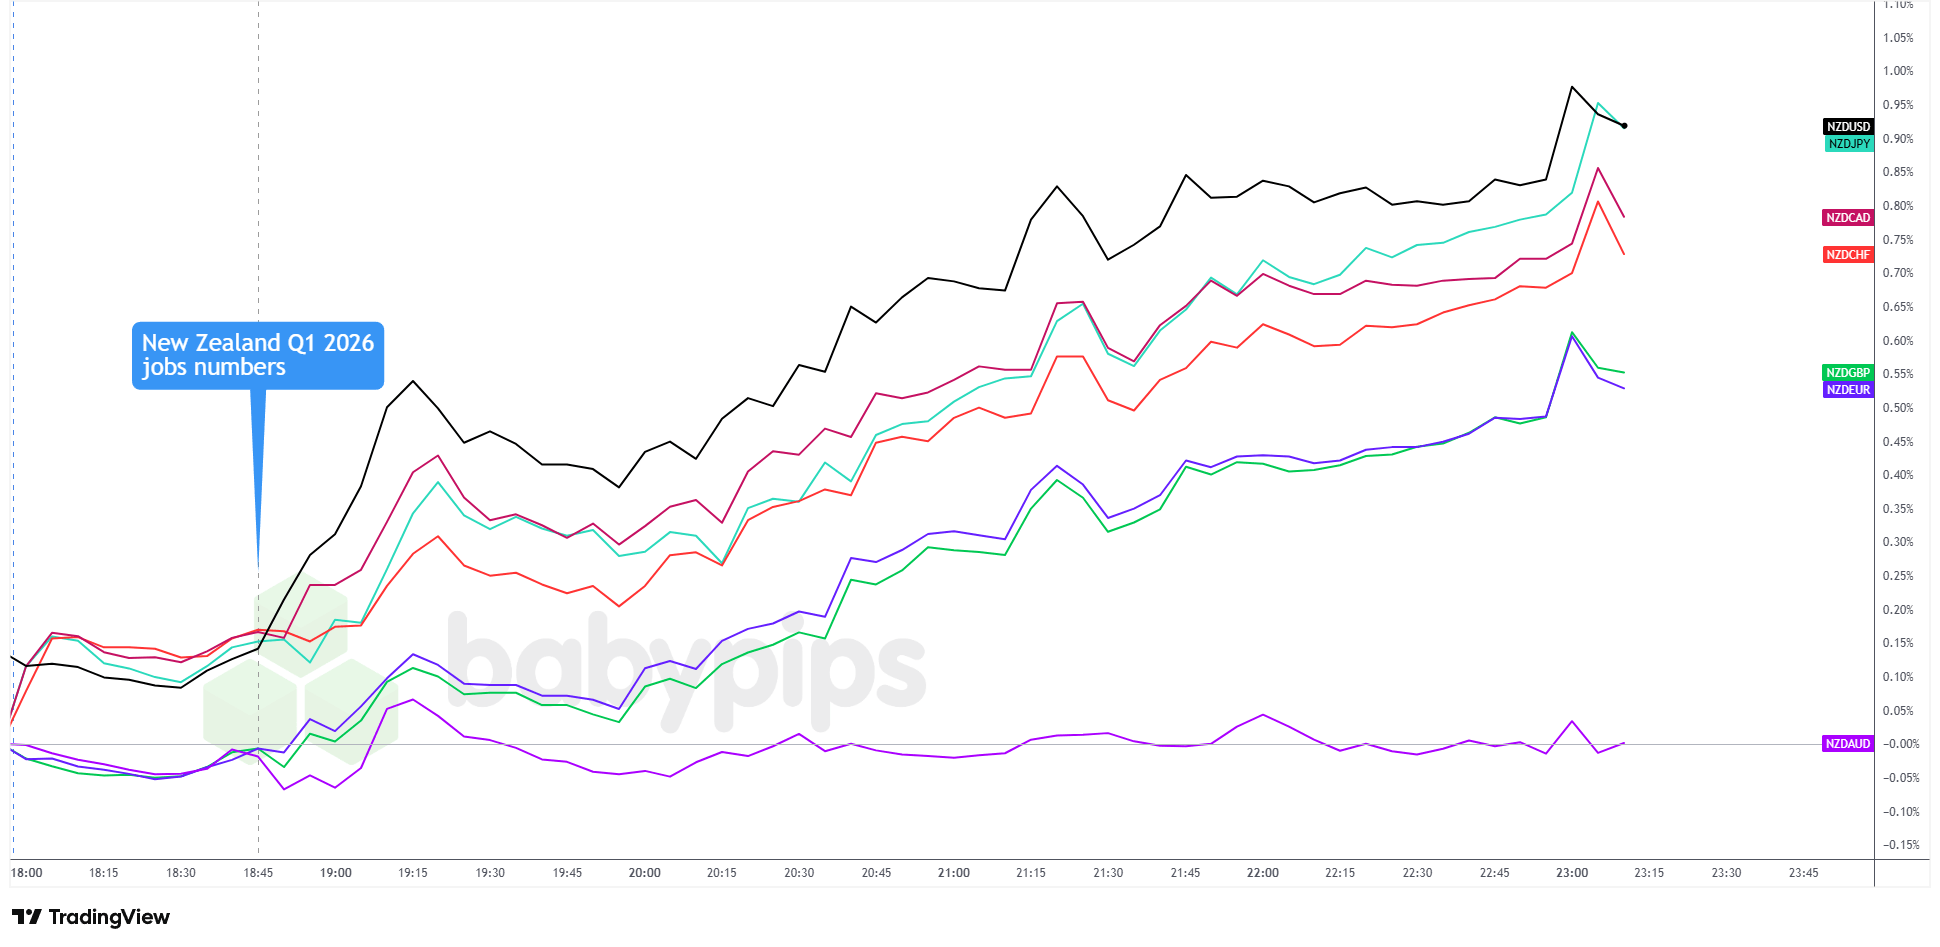
Overlay of NZD vs. Major Currencies Chart Faster with TradingView
This is probably why the New Zealand dollar strengthened broadly following the report’s release, with traders focusing on the headline beat against the 5.4% forecast and sustaining that bid through the remainder of the session.
NZD/USD heads the pack with around a 0.80% gain for the day, closely followed by NZD/JPY, NZD/CAD, and NZD/CHF. NZD/AUD is a notable exception, trading essentially flat throughout, suggesting both commodity currencies moved in lockstep, limiting any meaningful divergence on the cross.
With July now fully priced for a hike, the RBNZ’s next move hinges on whether wage growth stays contained and whether subsequent data shows the Middle East conflict leaving a deeper mark on the labour market than Q1 captured.
Business confidence and consumer sentiment surveys in the coming weeks will offer the earliest forward read on those questions, and any deterioration could temper the Kiwi’s reaction to Wednesday’s relatively constructive print.
This article covers New Zealand’s Q1 2026 labor market data and what it means for RBNZ policy, but if you’re not familiar with how the Reserve Bank of New Zealand operates and what drives the Kiwi, you may be missing key context. Premium members can read our lesson:
Reading this helps you understand how the RBNZ sets monetary policy, which economic indicators move NZD/USD, and how New Zealand’s trade relationships and data releases translate into currency moves.
And if you’re not a Premium subscriber yet, now’s a good time to sign up.
With Babypips Premium, you get full access to School of Pipsology lessons that help you understand not just what the numbers show, but the central bank dynamics and economic indicators that explain why the Kiwi moves the way it does.


