


U.S. consumer prices accelerated sharply in May, with the Bureau of Labor Statistics reporting the all-items CPI increased 0.5% on a seasonally adjusted month-on-month basis as expected, following a 0.6% gain in April.
The annual rate climbed to 4.2%, up from 3.8% in April and 3.3% in March, marking the third consecutive month of strong headline gains and the highest annual reading in over three years.
Real average hourly earnings fell 0.7% over the year through May, extending the squeeze on household purchasing power into a second consecutive month. Core inflation remained comparatively contained at 2.9% annually, but the data gives the Federal Reserve little room to ease policy in the near term.
Key Takeaways
- Headline CPI: +0.5% month-on-month (seasonally adjusted); +4.2% year-on-year — largest annual gain since April 2023
- Core CPI (ex-food & energy): +0.2% month-on-month; +2.9% year-on-year (up from 2.8% in April)
- Energy: +3.9% month-on-month; +23.5% year-on-year — accounted for over 60% of the monthly all-items rise
- Gasoline: +7.0% month-on-month; +40.5% year-on-year
-
Food: +0.2% month-on-month; +3.1% year-on-year
- Food at home: +0.1% MoM; food away from home: +0.3% MoM
-
Shelter: +0.3% month-on-month; +3.4% year-on-year
- Owners’ equivalent rent: +0.3% MoM; primary rent: +0.4% MoM
- Motor vehicle insurance: -1.7% month-on-month — largest decline since October 2020
- Airline fares: +2.7% month-on-month; +26.7% year-on-year
- Medical care: +0.3% month-on-month, driven by dental and hospital services
- Core goods: -0.1% month-on-month — new vehicle prices fell 0.3%, used cars edged up 0.1%
- Real average hourly earnings: -0.7% year-on-year
Energy accounted for a large chunk of the increase, as gasoline prices vaulted 7.0% on a seasonally adjusted basis over the month, with fuel oil adding 3.8%, as ongoing US-Iran hostilities in the Middle East kept upward pressure on crude oil through May. The energy index is now running at 23.5% above year-ago levels, its highest since mid-2022.
Stripping out food and energy, however, the picture looks considerably more contained. Core CPI rose just 0.2% on the month after a 0.4% gain in April. The slowdown was partly mechanical: motor vehicle insurance, which had been a persistent source of services stickiness, fell 1.7% in May in its biggest monthly drop since October 2020.
Link to official U.S. Consumer Price Index (May 2026)
Shelter remained firm but not accelerating. Primary rents rose 0.4% and owners’ equivalent rent posted 0.3%, broadly matching April’s pace rather than re-accelerating.
Airline fares rose a further 2.7%, reflecting the knock-on effect of elevated jet fuel costs while healthcare services gained 0.5%, led by dental and hospital services.
Promoted: The in-line U.S. CPI print fueled by elevated energy prices gave USD traders a fresh reminder: initial market reactions aren’t always sustained.
FundedNext gives disciplined traders a way to test their edge with simulated trading accounts up to $200K, no artificial time limits on challenges, and the flexibility to trade CFDs or Futures, even during major news events.
You can also earn a unique 15% profit share during your evaluation, then keep up to a 95% profit split once funded, with guaranteed 24 hour payouts. Because when markets move fast, your capital situation should not be the thing holding you back.
Learn More About FundedNext!
Disclosure: We may earn a commission from our partners if you sign up through our links, at no extra cost to you.
Market Reactions
United States Dollar vs. Major Currencies: 5-min
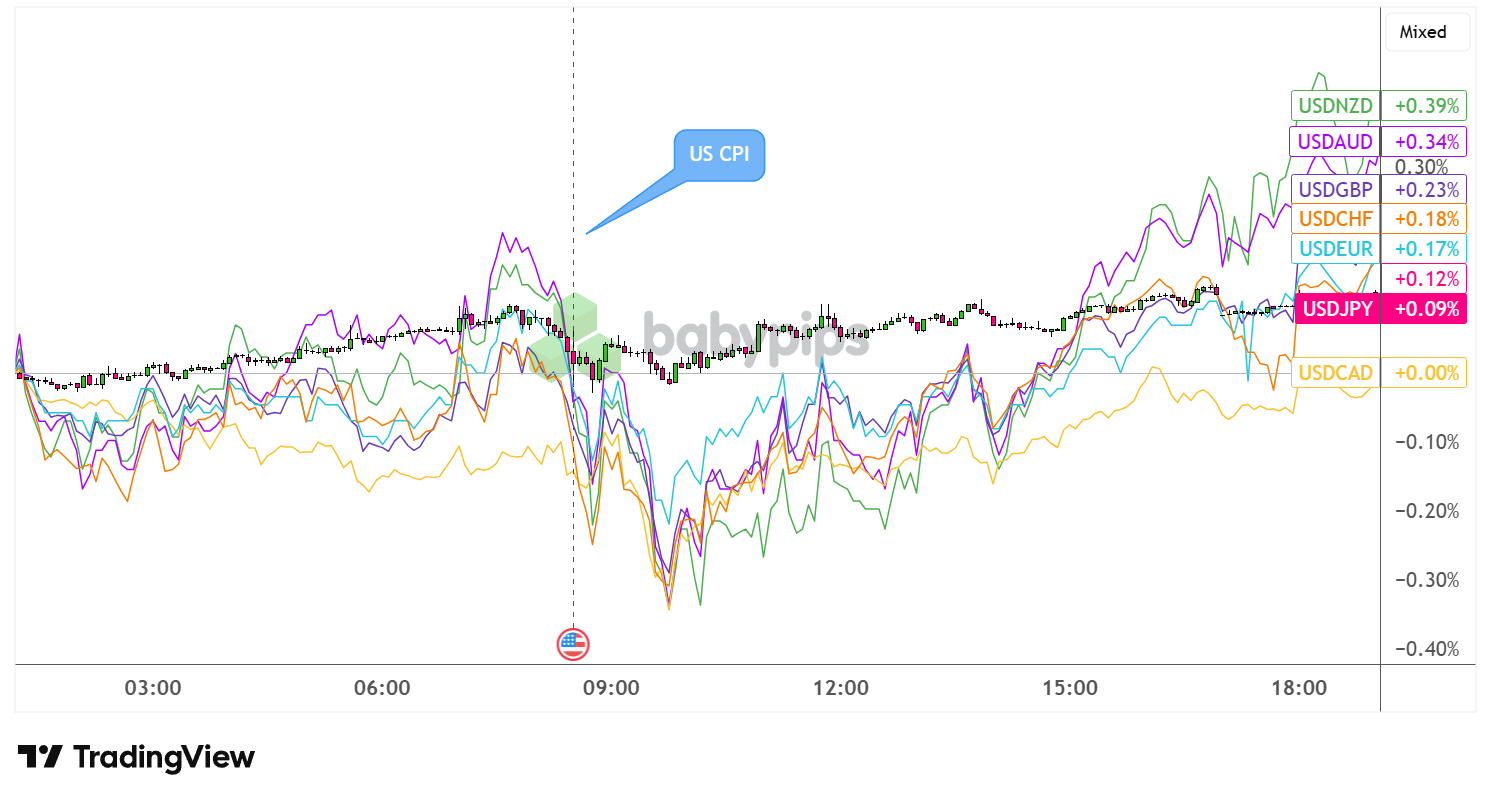
Overlay of USD vs. Major Currencies Chart Faster with TradingView
By the end of the trading day, the greenback gained roughly 0.30–0.40% against the Australian dollar and New Zealand dollar, approximately 0.23% against sterling, and 0.17% against the euro and Swiss franc. The Canadian dollar was the relative outperformer, finishing near flat against the USD. The Japanese yen lagged slightly on the day.
Equity markets moved lower while US Treasury yields rose, reflecting the repricing of rate cut expectations. The dollar’s intraday recovery from initial weakness is consistent with markets concluding that, while the data doesn’t open the door to a rate hike, it firmly closes the door on near-term rate cuts.
This article covers a hot U.S. CPI report, and if terms like core inflation, CPI vs. PCE, or what a 4.2% annual print actually means for Fed policy aren’t fully clear, Premium members can read our lesson:
📖 Inflation: The Force That Moves Central Banks
Reading this helps you understand how CPI and other inflation measures work, why central banks target 2%, and how inflation regimes shape currency values and trading decisions.
And if you’re not a Premium subscriber yet, now’s a good time to sign up.
With Babypips Premium, you get full access to School of Pipsology lessons that help you understand not just what the inflation numbers say, but why they move central banks and what that means for currencies.


