





Canada lost 68,300 jobs in September 2026. Economists polled by Reuters expected a gain of about 9,000, so the miss is wide. The unemployment rate rose to 6.5% from 6.4%, matching forecasts. But look past the rate: the labor force (everyone with a job or searching for one) kept shrinking.
Canada Jobs Report: Key Takeaways
-
- Jobs: Employers cut 68,300 jobs in September, after 41,700 in August. Full-time work fell by 35,400 and part-time work fell by 32,900.
- Unemployment rate: 6.5%, up from 6.4% and in line with forecasts.
- Job losses by sector: Education and health care lost 58,400 jobs combined. Manufacturing lost 12,700, and workers aged 15 to 24 lost 48,000.
- Participation rate: 64.8%, down 0.2 points and the lowest in 29 years outside the pandemic era.
- Wages: Average hourly pay for permanent employees rose 2.3% from a year earlier, up from 2.0% in August.
- Next up: The Bank of Canada announces its rate decision on Wednesday, October 28, 2026, at 9:45 AM ET.
What Were Canada’s Jobs Results for September 2026?
Canada’s job market shrank for a second straight month. Statistics Canada (the country’s official data agency) says employers cut 68,300 jobs in September 2026, after a loss of 41,700 in August. Reuters polled economists, and they expected a gain near 9,200 jobs. That is a wide miss.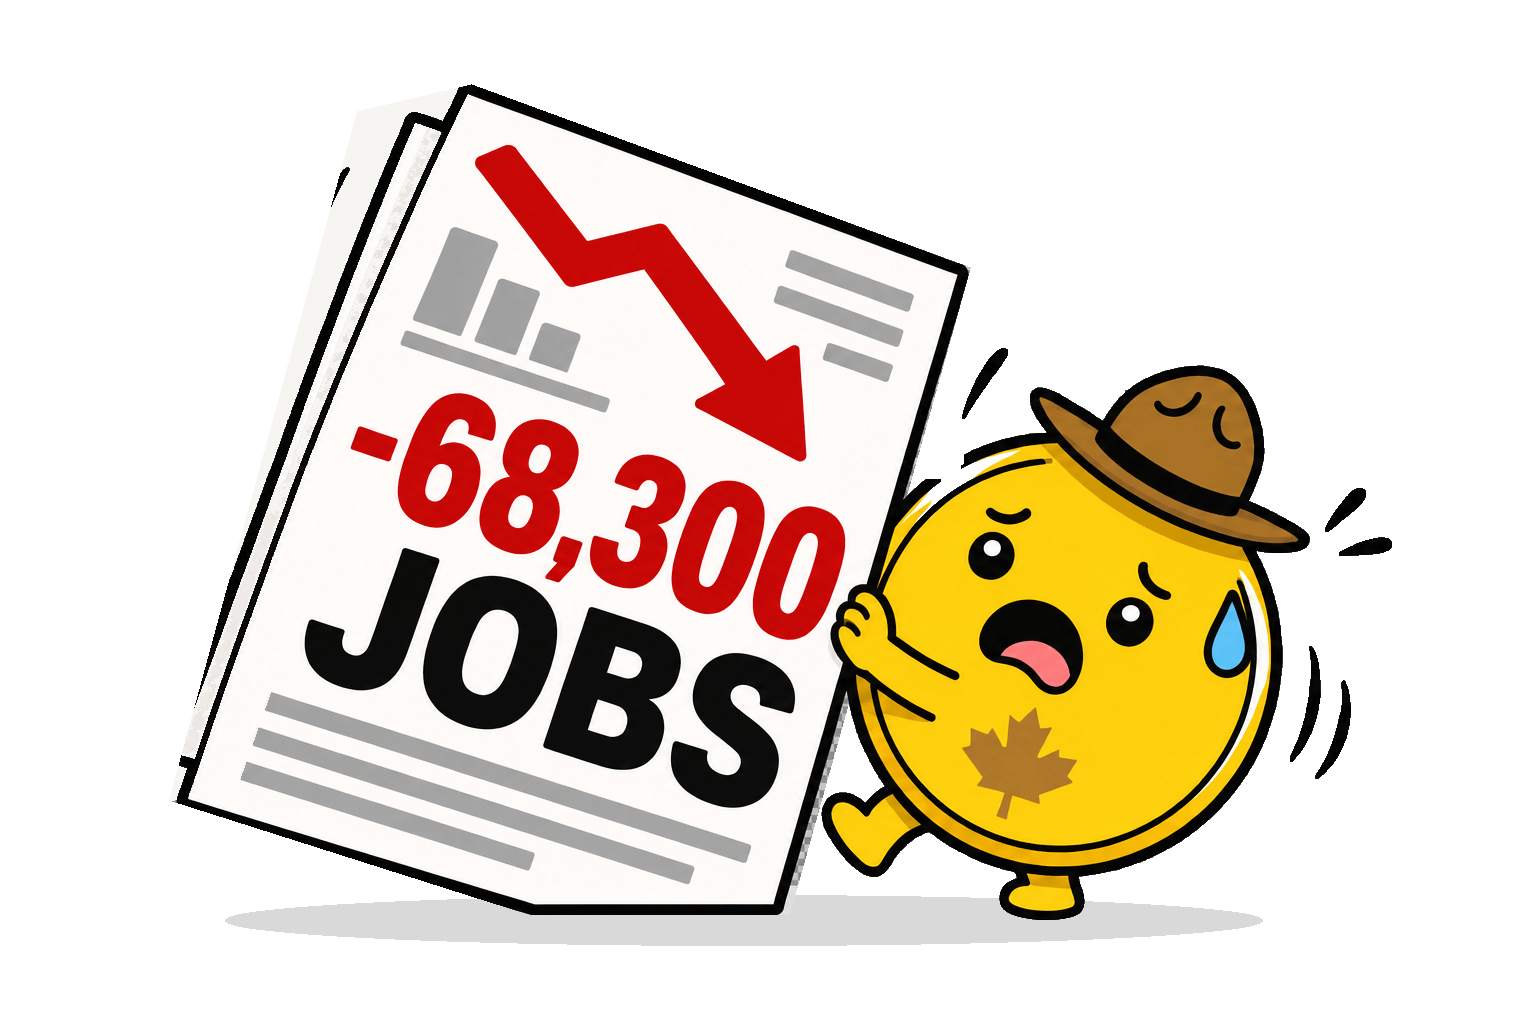
Full-time work fell by 35,400 and part-time work fell by 32,900, so neither group carried the drop alone. The unemployment rate (the share of people who want a job and cannot find one) rose to 6.5% from 6.4%, which the markets saw coming.
The year-to-date picture looks rough. Canada has lost a net 41,200 jobs in 2026 so far. A year earlier, the same stretch brought a gain of 211,300 jobs.
Why Did Canada Lose Jobs in September?
Education and health care took the biggest hits. Educational services and health care and social assistance lost 58,400 jobs combined. Both are large public-sector employers (jobs that governments fund), and public-sector employees posted the biggest drop overall. Statistics Canada links part of the education drop to fewer international students arriving.
Factories cut jobs too. Manufacturing (the sector that builds goods like cars and machinery) lost 12,700 jobs, and workers aged 15 to 24 lost 48,000 jobs. Traders have kept an eye on Canadian exporters since new U.S. tariffs (taxes on imported goods) arrived. Yet job losses did not stand out in industries that sell to the United States. Economists cited by BNN Bloomberg think the tariffs touch a small share of jobs and are unlikely to move employment data much.
Why Did the Unemployment Rate Hold Near 6.5%?
Fewer people searched for work. Picture the labor force as a waiting room. If people leave the room, the line looks shorter, but nobody got called in. Statistics Canada counts someone who stops looking as outside the labor force, so that person drops out of the unemployment rate.
The participation rate (the share of working-age people who have a job or want one) fell to 64.8% from 65.0%. That is the lowest reading in 29 years outside the pandemic era. Reports on the data point to an aging population and slower immigration as the main causes. Wages offer a brighter signal. Average hourly pay for permanent employees rose 2.3% from a year earlier, up from 2.0% in August.
Promoted: Chart the Canadian Jobs Report
A jobs report gives you the numbers. A chart shows how traders responded. On TradingView Supercharts, you can mark the 8:30 AM ET release on a Canadian dollar pair like USD/CAD. Then draw support and resistance levels (prices where a market has often paused or turned), or add any of 100,000+ community indicators. The built-in economic calendar lists upcoming Canadian releases, so you can see which data may move the pair next.
Explore TradingView Supercharts
Disclosure: To help support our content, we may earn a commission from our partners if you sign up through our links, at no extra cost to you.
What Does This Mean for the Bank of Canada?
The Bank of Canada (BoC, the country’s central bank) makes its next rate decision on Wednesday, October 28, 2026, at 9:45 AM ET. Its policy rate (the benchmark rate that sets borrowing costs across the economy) sits at 2.25%. Inflation ran at 3.0% in August, above the BoC’s 2% target, and bets on a hike had been creeping up before the report. Traders trimmed those bets after the numbers, signaling expectations of no hike for October and a 25 basis point hike (a basis point is 0.01 percentage points) in December.
The BoC now faces mixed signals. Jobs are falling and the labor force is shrinking, yet inflation sits above target. September inflation data arrives on Monday, October 19, 2026, at 8:30 AM ET, ahead of the decision. This was the last jobs report before the BoC meets.
What Does This Mean for Canadian Dollar Traders?
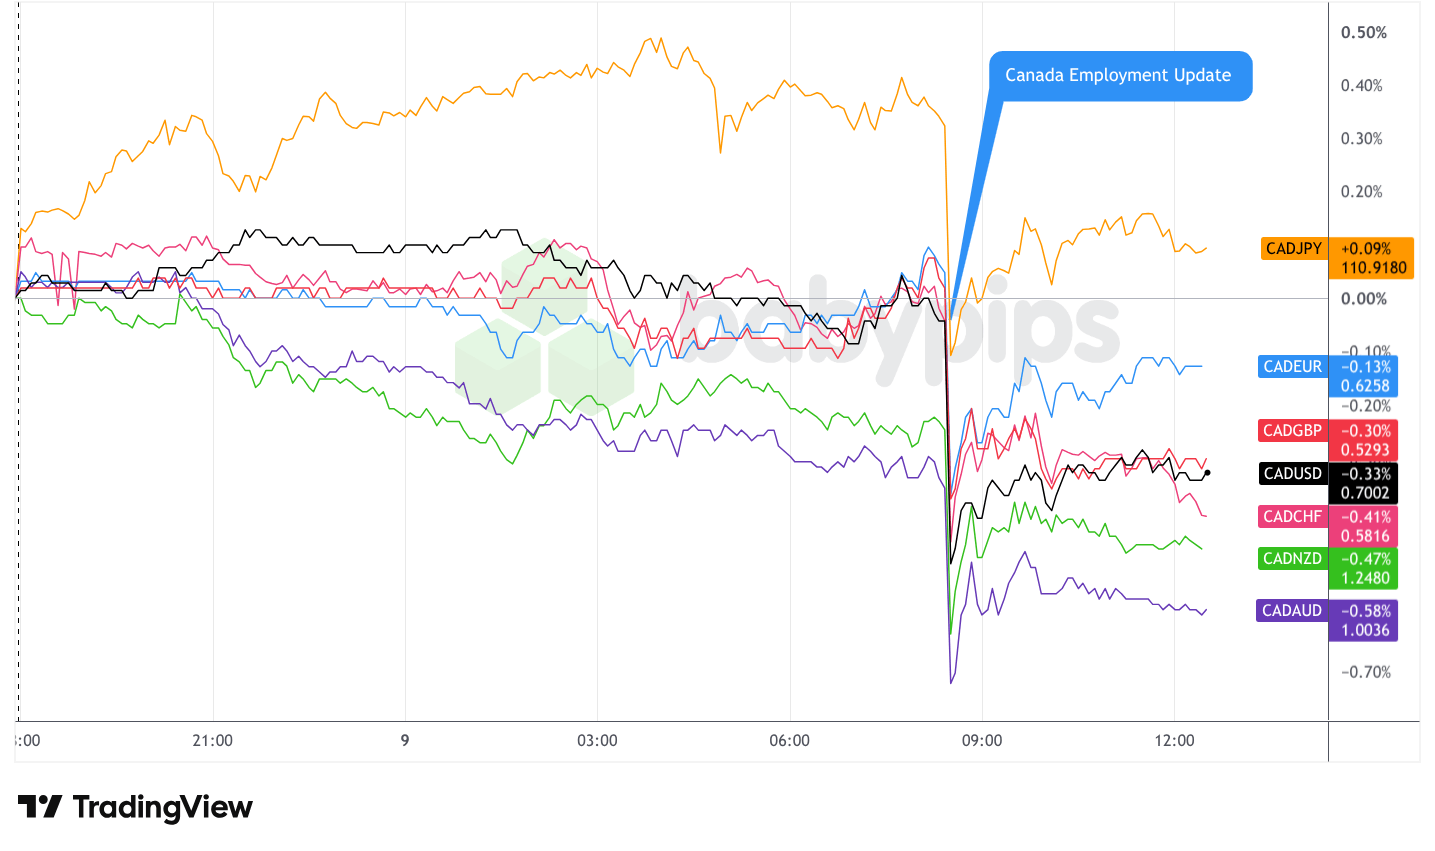
Overlay of CAD vs. Major Currencies – Chart Faster with TradingView
The loonie fell on the news. USD/CAD, the price of one US dollar in Canadian dollars, climbed about 50 pips in the 15 minutes after the 8:30 AM ET release. (A pip is 0.0001, the smallest standard price step.) The Canadian dollar traded down 0.44% at 1.4287 per US dollar.
Bond traders reacted too. Two-year government bond yields (the return investors earn on that debt) fell 9.5 basis points to 2.410%. Lower yields make holding Canadian dollars less rewarding, so short-term traders often sell the currency after a move like this.
Three dates matter next. Canadian inflation arrives Monday, October 19, 2026, at 8:30 AM ET. The BoC decision follows on Wednesday, October 28, at 9:45 AM ET. The October jobs report lands Friday, November 6, 2026, at 8:30 AM ET. One report does not set a trend, because the survey is a sample and single months can swing.
Canada lost 68,300 jobs in September, far more than economists expected, and USD/CAD jumped within minutes. Many traders are unsure why a single report can move a currency that fast. Premium members can read our lesson:
📖 From Data to Price Action: What Happens When Big News Hits
Reading this helps you understand the initial algorithmic spike, the secondary analytical move that follows, and the common traps that catch traders who react too quickly.
And if you’re not a Premium subscriber yet, consider joining.
With Babypips Premium, you get full access to School of Pipsology lessons that help you understand not just the spike on the chart, but how the market settles once the first reaction fades.



