


Canada’s economy just put in a good shift. GDP grew 0.5% in April 2026, beating the 0.4% forecast and posting the best month since July 2025. The gain rode in on a wave of oil and gas output and erased March’s 0.1% dip. But before you start celebrating, check the fine print: Statistics Canada’s own advance read on May shows growth cooling to just 0.1%. One good month does not make a trend.
Canada GDP April 2026: Key Takeaways
- Headline GDP: Real GDP rose 0.5% month-over-month in April, topping the 0.4% forecast from economists polled by Reuters and bouncing back from March’s 0.1% drop.
- Goods-producing industries: Climbed 1.2%, the strongest showing all year, with oil and gas doing the heavy lifting.
- Mining, quarrying, and oil and gas extraction: Surged 2.9%, the biggest jump since February 2024, as oil sands output rebounded 6.6% after months of maintenance headaches.
- Services-producing industries: Rose 0.3% for a third straight month, carried by the public sector and transportation.
- Breadth check: 14 of 20 industrial sectors grew in April, which is about as broad-based as economic data gets.
- Plot twist: Statistics Canada’s advance estimate already shows growth slowing to 0.1% in May.
- Policy backdrop: The Bank of Canada held its key rate at 2.25% on June 10 and meets again July 15.
What Were Canada’s GDP Results for April 2026?
Statistics Canada dropped its April GDP report on June 30, and it came in stronger than economists expected: real GDP grew 0.5%, ahead of the 0.4% consensus forecast from a Reuters poll. Quick refresher: real GDP measures the total value of goods and services a country produces, with the effects of rising prices stripped out. Think of it as the economy’s actual output, not just bigger price tags on the same stuff.
April’s bounce reversed March’s 0.1% contraction and marked the best single month since July 2025. Goods-producing industries (mining, manufacturing, construction, and the like) jumped 1.2%. Services-producing industries (think finance, real estate, and transportation) added a more modest 0.3% for their third straight monthly gain. Fourteen of Canada’s 20 industrial sectors grew, so this was not a one-trick rally.
What Drove the Rebound in Canadian GDP?
Oil. Oil drove it. The mining, quarrying, and oil and gas extraction sector jumped 2.9% in April, its fastest pace since February 2024, more than making up for March’s 1.4% slide. Oil sands output alone expanded 6.6% once unscheduled maintenance that had bogged down production for months cleared, letting synthetic crude output ramp back up.
Manufacturing chipped in too, rising 0.6% on stronger machinery output, while construction grew 0.7% for its first gain in five months. Transportation and warehousing climbed 0.9%, helped by a 3.8% rebound in rail transportation as grain and automotive shipments picked up. Finance and insurance rose 0.4%, with both banks and mutual funds pulling their weight.
Promotion: If your confidence has grown in your market awareness & strategies, and you wanna take action, Maven Trading can help. They provide simulated funding challenges starting as low as $15, allowing you to trade major pairs with professional-sized capital. No time limits mean you can take swing plays on these market themes without the pressure of a ticking clock.
Learn More About Maven Trading Today! And for a limited time: Use code “ETERNAL” for 10% off Challenge fee!
Disclosure: We may earn a commission from our partners if you sign up through our links, at no extra cost to you.
Is the Canadian Economy Actually Strengthening?
Here is the catch. Statistics Canada’s advance estimate for May points to growth of just 0.1%, a sharp comedown from April’s pace. That preliminary number shows gains in finance and real estate getting offset by declines in wholesale trade and agriculture, a much thinner spread than April’s broad 14-of-20 sector rally.
Mining and quarrying outside of oil and gas actually fell 0.1% in April, its third straight monthly decline thanks to maintenance shutdowns at mines in Northern Saskatchewan. Business investment has also stayed soft, with the looming Canada-United States-Mexico Agreement (CUSMA) review keeping companies cautious about spending. Canada’s economy was flat in the first quarter of 2026 on a quarterly basis, following a 0.2% contraction the quarter before that, so April’s strength comes off a low bar rather than a running start.
What Does This Mean for the Bank of Canada?
Short answer: not much changes. The Bank of Canada held its policy rate (the benchmark borrowing cost that ripples through everything from mortgages to business loans) at 2.25% on June 10, where it has sat since October 2025. Inflation has been climbing along with global oil prices tied to the Middle East conflict, with annual CPI hitting 3.2% in May, the highest reading since September 2023.
A stronger GDP print usually nudges a central bank toward higher rates to cool inflation. But a soft May estimate and a labour market that is still finding its footing give the Bank cover to sit tight. Mark July 15 on your calendar. That is the next rate decision, paired with a fresh Monetary Policy Report that has to make sense of a strong April followed by a much weaker May.
What Does This Mean for CAD Traders?
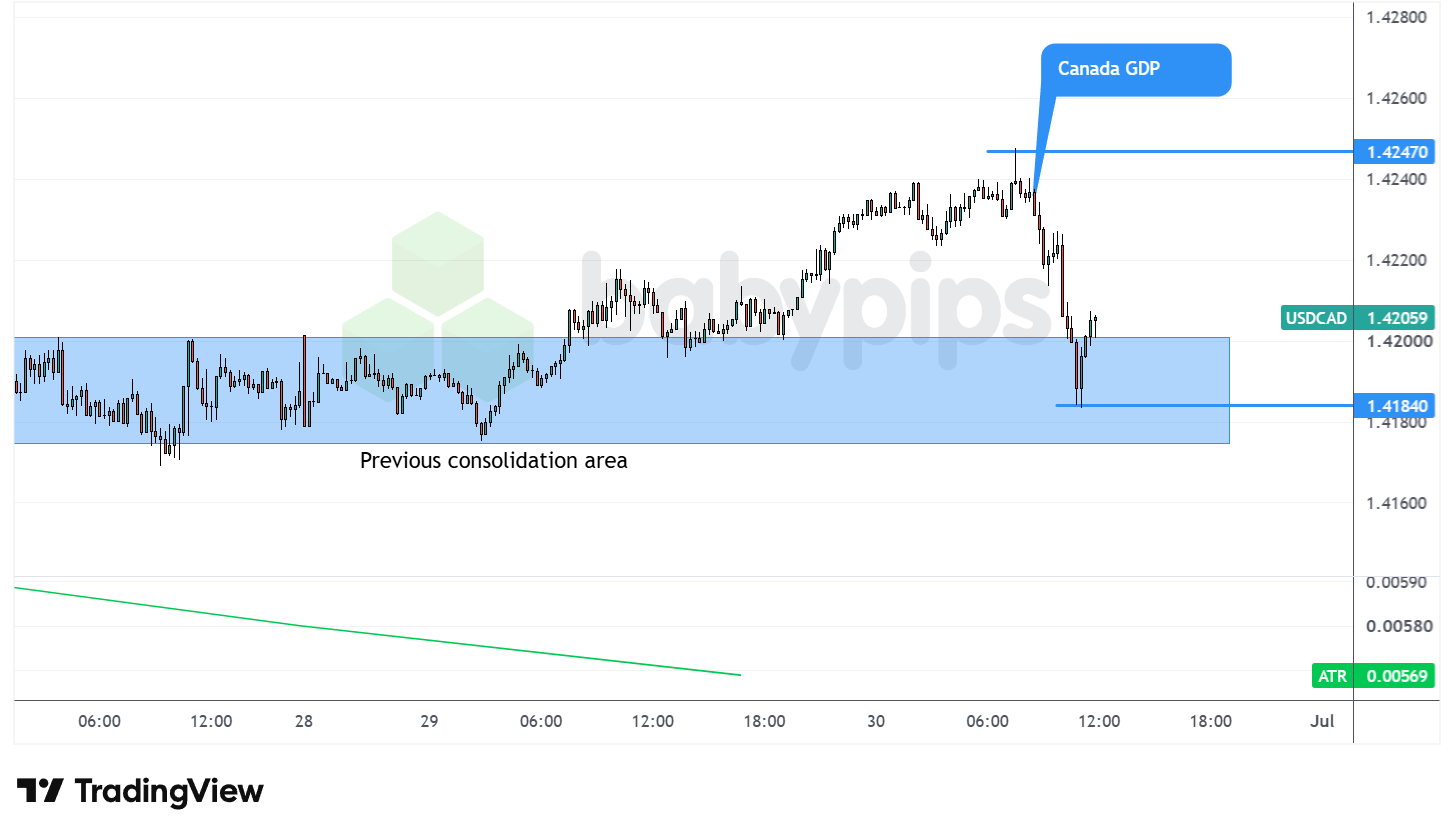
USD/CAD 1-hour Forex Chart Faster With TradingView
The loonie got a little wind in its sails. USD/CAD pulled back from an intraday high near 1.4247 to around 1.4184 after the GDP release, as the upside surprise gave the Canadian dollar a quick lift. But zoom out and the bigger story is still US dollar strength: CAD has been under pressure through June from a hawkish Federal Reserve under new Chair Kevin Warsh and interest rate differentials that keep favoring the greenback.
For traders, it’s likely today’s beat will be treated as a small tailwind, not a trend change. The Bank of Canada’s wait-and-see stance, the unresolved CUSMA review, and a soft May GDP estimate all argue against reading too much into one strong print. Keep your eyes on the July 15 rate decision and any CUSMA headlines for the next real mover on USD/CAD.
Promoted: One Good GDP Print Doesn’t Make a Trader Right.
April’s number beat expectations. May’s advance estimate did not. That kind of whiplash tempts traders into chasing a headline instead of waiting for confirmation. In “Market Wizards: The Next Generation,” Jack Schwager interviews a new generation of traders who built consistent profitability through process and discipline, not one great call. If conflicting data like today’s GDP report tends to rattle your conviction, this one is worth a read.
Get Market Wizards: The Next Generation on Amazon!
Disclosure: We may earn a commission from our partners if you sign up through our links, at no extra cost to you.
Frequently Asked Questions About Canada’s GDP
What does Canada’s GDP report measure?
Canada’s monthly GDP by industry report, published by Statistics Canada, tracks how much the total value of goods and services produced across roughly 20 industrial sectors changes from month to month. It is one of the broadest, most up-to-date snapshots of how the Canadian economy is doing.
Why does Canadian GDP matter for forex traders?
Strong GDP growth tends to support expectations for higher interest rates and a stronger currency, while weak growth usually does the opposite. Since the report can shift expectations for Bank of Canada policy, it regularly moves the Canadian dollar the moment it drops.
What happened to Canada’s GDP in April 2026?
Real GDP rose 0.5% month-over-month, beating the 0.4% forecast and bouncing back from March’s 0.1% decline. A 2.9% jump in mining, quarrying, and oil and gas extraction led the way, with 14 of 20 sectors expanding.
What does this mean for the Bank of Canada’s next rate decision?
The Bank of Canada held its rate at 2.25% on June 10 and is unlikely to make any sudden moves based on a single month of data. Its next decision lands July 15, where it will weigh April’s strength against a much softer 0.1% advance estimate for May.
Will Canada’s economic growth continue into the summer?
That is the big question. Statistics Canada’s own advance estimate points to growth slowing to 0.1% in May, and the ongoing CUSMA trade review combined with soft business investment add risk to the outlook heading into the third quarter.
What does the GDP report mean for the Canadian dollar?
The beat gave USD/CAD a modest pullback from its intraday high on release day, but the loonie still faces broader pressure from a hawkish US Federal Reserve and wide interest rate differentials. Traders are watching the July 15 Bank of Canada decision for the next significant move.
Canada’s GDP beat expectations in April, but the Canadian dollar’s response was muted. Understanding why requires knowing what economic growth signals to central banks and how growth differences between countries actually drive currency moves. Premium members can read our lesson:
📖 Economic Growth: The Force That Shapes Central Bank Thinking
Reading this helps you understand what economic growth actually is, how to read it before the official numbers arrive, and why differences in growth between Canada and the US are where the biggest currency trends begin.
And if you’re not a Premium subscriber yet, now’s a good time to sign up.
With Babypips Premium, you get full access to School of Pipsology lessons that help you understand not just the numbers coming out of central banks, but what those numbers signal about monetary policy divergence and interest rate differentials that actually move currency pairs


