





Oil cratered more than 4% on Iran de-escalation hopes, dragging Treasury yields lower and lifting equities, while the U.S. dollar finished as a net underperformer against the major currencies. Traders also parsed a weaker-than-expected U.S. consumer confidence reading ahead of Wednesday’s core PCE report and Friday’s first Jackson Hole speech from Fed Chair Kevin Warsh.
Check out the forex news and economic updates you may have missed in the latest trading session!
News Headlines & Data:
- Al Arabiya sources say Pakistan’s army chief carried a de-escalation proposal to Tehran
- Japan Leading Indicators Index for June 2026: 116.5 (114.0 forecast; 116.5 previous)
- Germany GDP Growth Rate Final for Q2 2026: 0.3% q/q (0.2% q/q forecast; 0.3% q/q previous)
- Germany Ifo Business Climate for August 2026: 88.8 (87.0 forecast; 86.6 previous)
- U.S. ADP Employment Change Weekly for August 8, 2026: 11.75k (9.5k previous)
- Canada Wholesale Sales Prel for July 2026: -0.6% m/m (-1.3% m/m forecast; 2.8% m/m previous)
- U.S. Building Permits Final for July 2026: 4.3% m/m (5.0% m/m forecast; -2.6% m/m previous)
- U.S. House Price Index for June 2026: 2.3% y/y (2.2% y/y forecast; 2.2% y/y previous)
- U.S. S&P/Case-Shiller Home Price for June 2026: 2.1% y/y (1.8% y/y forecast; 1.6% y/y previous)
- U.S. Richmond Fed Manufacturing Index for August 2026: 4.0 (6.0 forecast; 5.0 previous)
- U.S. New Home Sales for July 2026: -10.5% m/m (-1.3% m/m forecast; 1.6% m/m previous)
- CB Consumer Confidence for August 2026: 89.4 (90.9 forecast; 90.8 previous)
- Federal Reserve Bank of Boston President Collins said on Tuesday that she supported holding interest steady, but would like to see more progress on bringing inflation back to the 2% target
- Canada announced 50% counter-tariffs on U.S. steel, aluminum, dairy, and other goods, affecting roughly $20 billion in annual U.S. exports, set to take effect September 8
Broad Market Price Action:
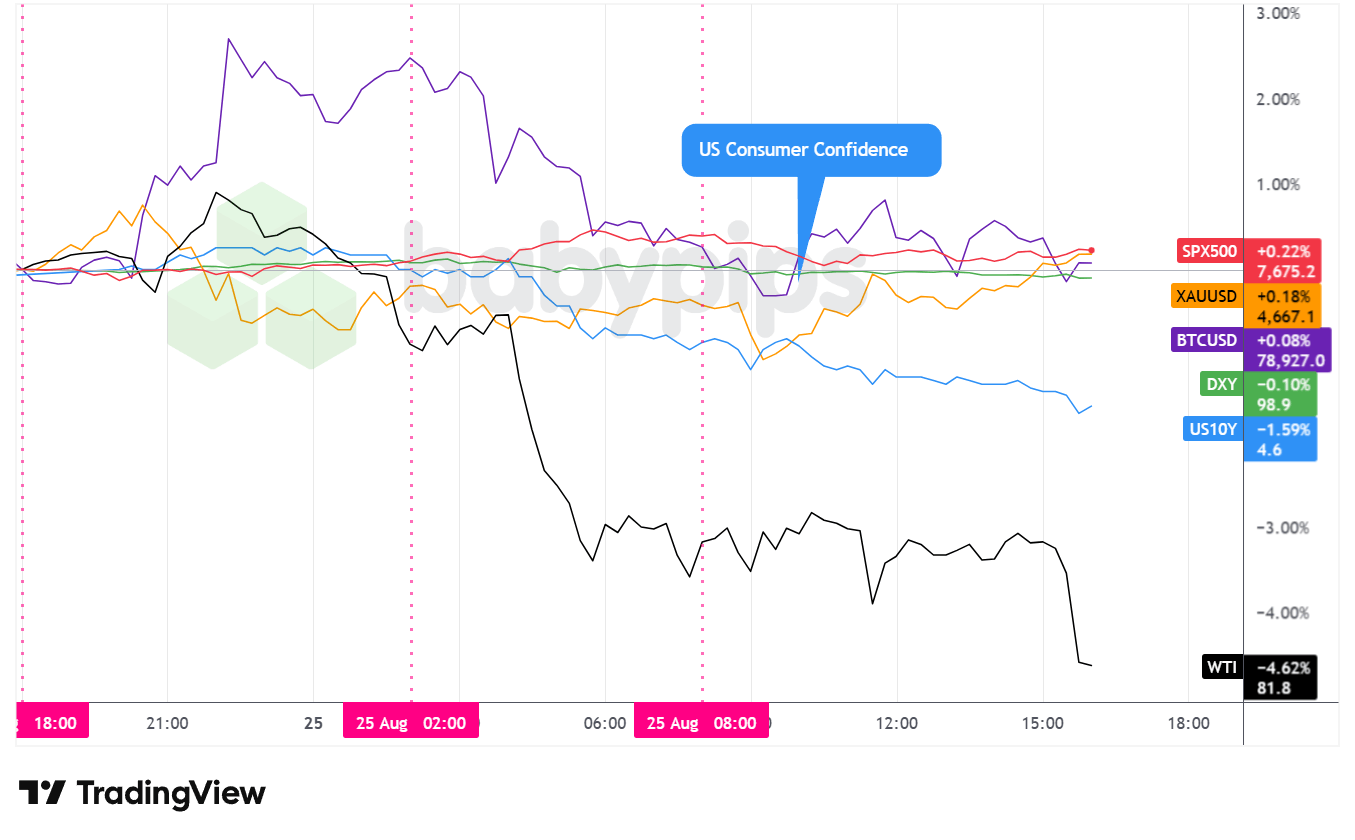
Dollar Index, Gold, Oil, S&P 500, U.S. 10-yr Yield, Bitcoin Overlay – Chart Faster With TradingView
The broad market overlay chart shows a sharp, dominant theme: crude oil fell roughly 4.6% on the session, pulling well clear of every other asset and turning the day into an energy-led story.
The S&P 500 posted a modest gain of around 0.2%, finishing near 7,675, with most of that move coming during the London session as oil declined and risk sentiment firmed on reports that Pakistan’s army chief was carrying a de-escalation proposal to Tehran. Stocks gave up some of those gains after the U.S. open, partly on a weaker-than-expected consumer confidence print, then ground slowly higher through the afternoon.
Gold ended the day slightly higher, near $4,667, after a volatile session. The metal spiked above $4,690 in Asian trade before reversing sharply below $4,640 with no clear single catalyst identified, then recovered during the U.S. session as lower oil prices reduced inflationary concerns and Treasury yields eased.
The 10-year U.S. Treasury yield fell roughly 1.6% on the day, finishing near 4.6% after opening the session closer to 4.72%. Falling energy costs played a likely role in loosening the inflation narrative that had kept upward pressure on long-end yields in recent sessions.
WTI crude oil’s drop accelerated through the London morning and continued into the U.S. session, finishing near $81.70, down from around $86 at the start of the prior overnight period. Reports of a Pakistan-brokered proposal aimed at reducing Iran-U.S. tensions drove the move, and mediators signaled they were continuing efforts to end the conflict. Let’s remember that similar optimistic headlines had previously failed to produce an agreement, so traders may be pricing de-escalation possibility rather than certainty.
Bitcoin ended near flat, around $78,927, after an earlier run above $81,000 during Asian hours faded through the London and U.S. sessions. The pullback from overnight highs broadly tracked the risk-on cooling as the U.S. open approached. With no asset-specific driver apparent on the day, Bitcoin’s relatively contained range may reflect positioning caution ahead of the high-impact macro events due Wednesday and Friday.
FX Market Behavior: U.S. Dollar vs. Majors
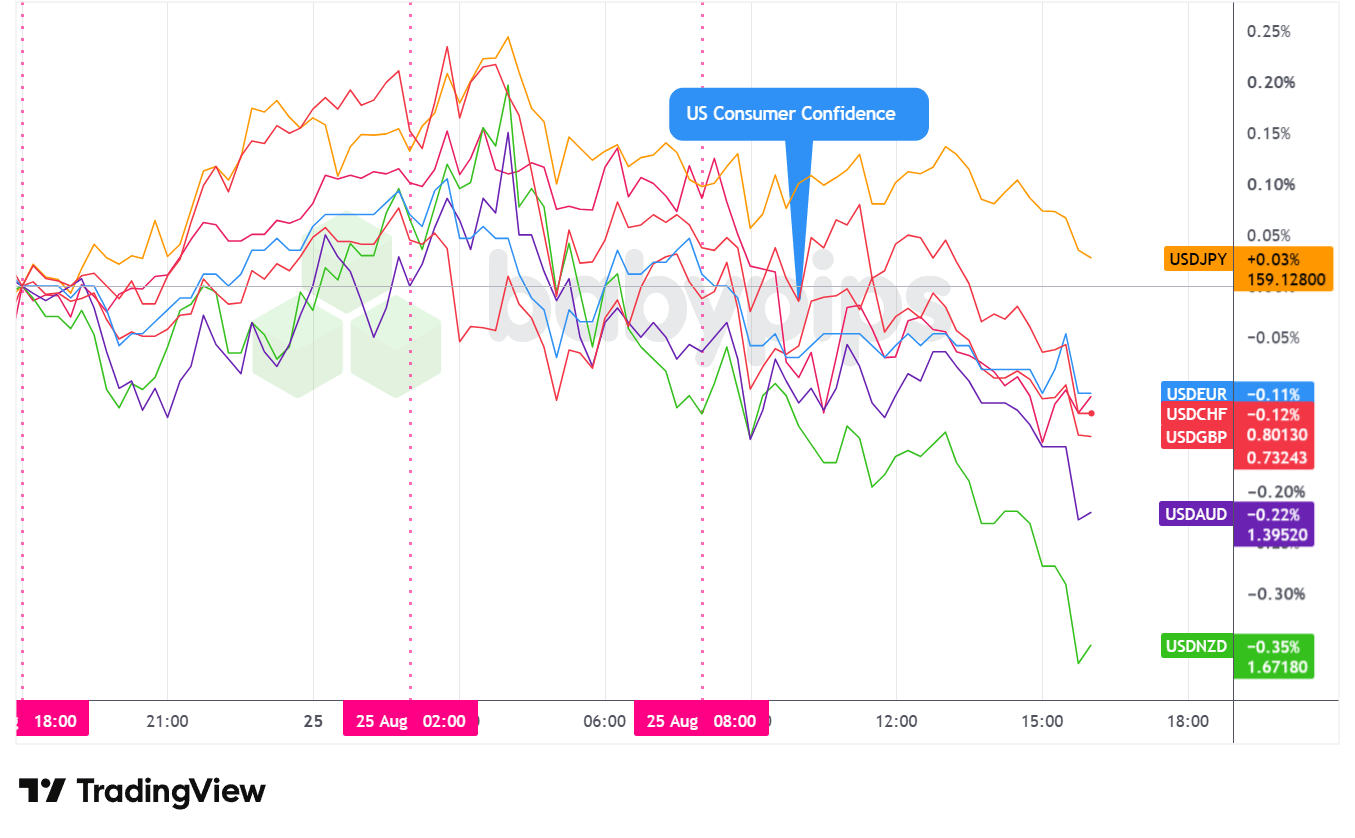
Overlay of USD vs. Major Currencies – Chart Faster With TradingView
From the Tuesday Asia open, the U.S. dollar dipped initially against the major currencies before rebounding, leaving the greenback leaning net bullish heading into the London open. There were no major drivers of note during the session, so an argument could be made that the rebound could have been a continuation of Monday’s strength, possibly related to a pullback in broad risk appetite as trade tensions lingered.
From the London open, sentiment shifted. De-escalation headlines on the Iran situation sent oil lower and risk appetite higher, and the dollar broadly gave back its earlier gains against most majors. The euro, pound, Australian dollar, and New Zealand dollar all moved higher against the greenback through London trade. The Canadian dollar initially strengthened early in the European session, but Canada’s announcement of 50% counter-tariffs on U.S. steel, aluminum, dairy, and other goods caused the loonie to pare those gains, leaving it little changed by midday New York time.
Into the U.S. afternoon, the dollar continued to drift lower against the broader basket. The New Zealand dollar was the standout outperformer, while the Australian dollar also pushed higher, possibly reflecting relief in risk-sensitive currencies as oil-driven inflation concerns eased. The Japanese yen remained an outlier throughout the entire session. Despite market pricing around an 80% probability of a Bank of Japan rate hike in September, the yen continued to stay weak against the dollar, finishing near 159.13. Arguments could be made that the BOJ may crack to external pressure rather than steering policy with confidence, which may be keeping the yen on the back foot even with rate hike expectations elevated.
At the Tuesday close, the U.S. dollar was a net underperformer against the major currencies on the day, with the DXY finishing near 98.89, down around 0.1% from the prior session close. The yen was the lone major currency that failed to strengthen against the dollar.
Upcoming Potential Catalysts on the Economic Calendar
- Australia Westpac Leading Index for July 2026 at 1:00 am GMT
- Australia Inflation Rate for July 2026 at 1:30 am GMT
- Swiss Economic Sentiment Index for August 2026 at 8:00 am GMT
- U.K. CBI Distributive Trades for August 2026 at 10:00 am GMT
- U.S. MBA Mortgage Applications for August 21, 2026 at 11:00 am GMT
- U.S. MBA 30-Year Mortgage Rate for August 21, 2026 at 11:00 am GMT
- U.S. Personal Income & Spending for July 2026 at 12:30 pm GMT
- U.S. Durable Goods Orders for July 2026 at 12:30 pm GMT
- U.S. Core PCE Price Index for July 2026 at 12:30 pm GMT
- U.S. GDP Growth Rate & Price Index 2nd Est for June 30, 2026 at 12:30 pm GMT
- EIA Crude Oil Stocks Change for August 21, 2026 at 2:30 pm GMT
- U.S. Fed Barkin Speech at 3:45 pm GMT
- Swiss SNB Martin Speech at 4:15 pm GMT
- U.S. Jackson Hole Symposium
Wednesday’s session arrives with two major items competing for attention: Australia’s July inflation rate at 1:30 am GMT, and then, from 12:30 pm GMT onward, a dense U.S. data block that includes core PCE, personal income and spending, durable goods orders, and the second GDP growth rate estimate for Q2 2026.
The core PCE release carries special weight this week as the Fed’s preferred inflation gauge lands just two days before Fed Chair Warsh delivers his first speech as chair at the Jackson Hole symposium. A hot PCE print could reinforce the case for a September rate hike and put renewed upward pressure on the dollar and long-end yields; a softer reading could extend the risk-on mood and keep the dollar on the defensive.
Tuesday’s weaker consumer confidence, the sizable drop in new home sales, and softer Richmond Fed reads all point to a slowing domestic backdrop, adding to the stakes around the data. Fed’s Barkin also speaks at 3:45 pm GMT.
Stay frosty out there, forex friends!
When oil cratered 4.6% on Iran de-escalation hopes and rippled through FX markets, most traders saw headlines. Savvy traders read the commodity-currency cross-current. Premium members can read our lesson:
📖 How Oil Moves with USD/CAD, USD/NOK, and CAD/JPY
Reading this helps you understand how oil price shocks move commodity-sensitive currency pairs, why Canadian and Norwegian dollars react differently to the same energy move, and how to use those relationships as confirmation signals for your trades.
And if you’re not a Premium subscriber yet, now’s a good time to sign up.
With Babypips Premium, you get full access to School of Pipsology lessons that help you understand how commodity moves drive specific currencies, so you can see the macro setup before it shows up on the chart



