





Oil erased Wednesday’s decline and then some on Thursday, as fresh doubts over how quickly the Strait of Hormuz might reopen sent crude to its best day in weeks, and the reversal rippled through equities, Treasury yields, and the U.S. dollar.
Stocks fell for a second straight session, with an AI-and-chip-driven selloff that started in Asia spilling into Wall Street trading, while Treasury yields climbed alongside oil on renewed inflation concerns. The dollar, which had closed broadly weaker on Wednesday, came all the way back to finish Thursday as the best-performing major currency, with Friday’s July jobs report now looming as the week’s decisive event.
Gold and Bitcoin each gave back a piece of Wednesday’s rally as some of the same forces worked in reverse, while a resilient batch of U.S. labor data, most notably a much smaller-than-feared round of Challenger job cuts, built its own case that Friday’s payrolls report could carry more upside risk than markets had assumed.
Check out the forex news and economic updates you may have missed in the latest trading session!
News Headlines & Data:
- Australia Balance of Trade for June 2026: 1.93B (-1.8B forecast; -3.02B previous)
- Australia Building Permits Final for June 2026: 8.9% y/y (8.9% y/y forecast; 5.3% y/y previous)
- Germany Factory Orders for June 2026: 3.1% m/m (0.4% m/m forecast; 1.9% m/m previous)
- Swiss Unemployment Rate for July 2026: 3.0% (2.9% forecast; 2.9% previous)
- Euro area S&P Global Construction PMI for July 2026: 44.3 (43.6 forecast; 42.8 previous)
- U.K. S&P Global Construction PMI for July 2026: 44.7 (40.9 forecast; 38.4 previous)
- Euro area Retail Sales for June 2026: 0.7% y/y (0.9% y/y forecast; 1.6% y/y previous)
- U.S. Challenger Job Cuts for July 2026: 33.43k (59.0k forecast; 45.85k previous)
- U.S. Initial Jobless Claims for August 1, 2026: 199.0k (199.0k forecast; 197.0k previous)
- U.S. Unit Labour Costs Prel for Q2 2026: 1.3% q/q (2.0% q/q forecast; 1.8% q/q previous)
- U.S. Nonfarm Productivity Prel for Q2 2026: 1.4% q/q (0.6% q/q forecast; 0.3% q/q previous)
- Canada S&P Global Services PMI for July 2026: 49.1 (48.0 forecast; 47.1 previous)
- U.S. Wholesale Inventories for June 2026: 0.2% m/m (0.3% m/m forecast; 0.1% m/m previous)
Have a solid trading strategy but lack the capital? FundedNext empowers disciplined traders by providing simulated trading accounts up to $200K.
Unlike other prop firms, FundedNext imposes no artificial time limits on challenges. You even earn a unique 15% profit share during your evaluation! Once funded, you keep up to a 95% profit split with guaranteed 24-hour payouts. Trade CFDs or Futures your way—even during major news events.
Join over 400K traders who have received $300M+ in payouts. Ready to back your edge?
Learn More About FundedNext! Limited time offer: Use code BPFN for discounts on both CFD & Futures plans! T&C apply.
Disclosure: We may earn a commission from our partners if you sign up through our links, at no extra cost to you.
Broad Market Price Action:
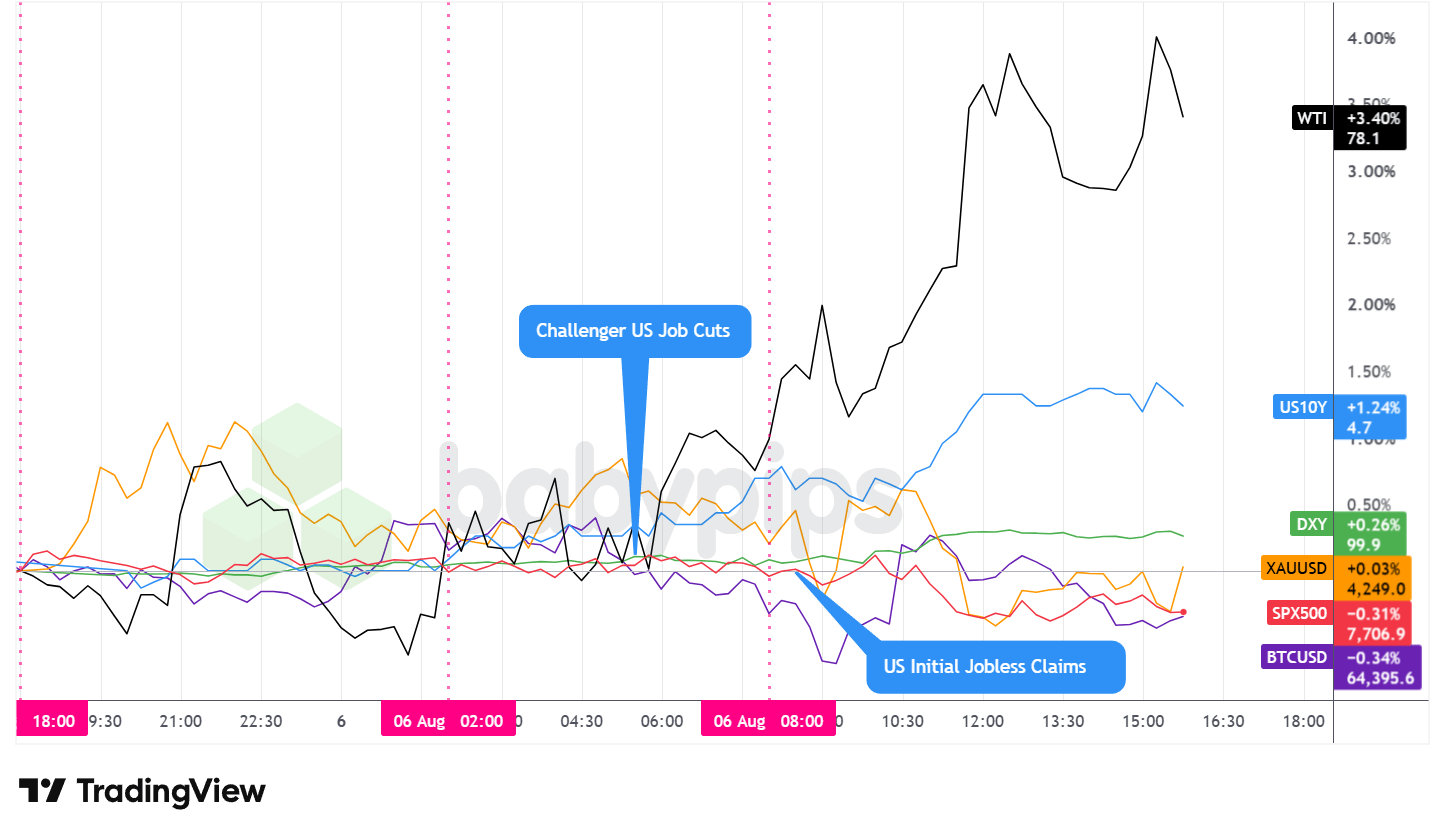
Dollar Index, Gold, Oil, S&P 500, U.S. 10-yr Yield, Bitcoin Overlay – Chart Faster With TradingView
Thursday’s price action told a single, connected story. A fresh scare over the Strait of Hormuz sent oil sharply higher, and that move worked its way through yields, stocks, and precious metals for the rest of the day.
WTI crude jumped roughly 3.40% to settle near $78.10, the session’s strongest performer by a wide margin. The move built slowly at first. Traders in Asia and London treated reports that Iran and Oman had agreed on shipping-route coordinates through the strait as reason for calm, and crude drifted only modestly higher through the European morning, trading near $75.80. That calm broke apart once Iran’s semi-official Fars News Agency circulated a draft plan for the strait carrying far more restrictive shipping conditions than the market had priced in. Crude accelerated through the U.S. afternoon to a session high near $78.70 before settling just under it. The whipsaw captures a pattern that has repeated for weeks now: diplomatic progress on paper does not always survive contact with the details, and Thursday’s price action suggests traders leaned toward skepticism by the close.
Treasury yields tracked oil higher, with the 10-year yield climbing roughly 1.24% to trade near 4.70%. A bigger energy bill raises the near-term inflation math, and that likely kept a floor under yields even with a couple of Fed officials sounding comfortable holding rates steady for now. Thursday’s U.S. data added its own support to that floor. Challenger, Gray & Christmas reported job cuts fell to 33.43k in July, well below the 59.0k forecast, while weekly initial jobless claims held at 199.0k, in line with estimates and a third straight week under the 200k mark. A separate report showed second-quarter productivity accelerated to 1.4%, above the 0.6% forecast, while unit labor costs rose a milder 1.3% against a 2.0% estimate. Wednesday, Fed Governor Lisa Cook said she views the risk to the inflation side of the Fed’s mandate as greater than the risk to employment right now, adding that “I am prepared to act” if disinflation stalls. San Francisco Fed President Mary Daly struck a more measured tone the same day, backing last week’s decision to hold rates steady while saying the Fed needs more data before September and would act aggressively if inflation momentum rebuilds. Between the two, Thursday’s data reinforced the idea that labor-market resilience will likely be the bigger swing factor heading into the Fed’s next decision.
U.S. equities fell for a second straight session, with the S&P 500 slipping roughly 0.31% to around 7,707. The index tracked a risk-off mood that started in Asia, where Japan’s Nikkei and South Korea’s KOSPI both fell hard as a chip-and-AI-infrastructure selloff carried over from Wednesday’s Wall Street session; the KOSPI’s slide extended past 4.5% at one point. Memory-chip makers Sandisk and Western Digital tumbled in New York after both companies’ forecasts underwhelmed investors despite otherwise solid results, adding fresh doubt about how much further AI-linked spending can support current valuations. Rising Treasury yields on the back of oil’s rally added their own pressure through the afternoon.
Gold told the more complicated story of the day. The metal climbed to a near a seven-week high above $4,300 an ounce on hopes that Hormuz progress would ease the inflation pressure the Fed has been watching, then gave essentially all of it back to close roughly flat, up just 0.03% near $4,249, almost exactly where it settled Wednesday. The retreat lines up with the same reversal that lifted oil. As Hormuz optimism faded and Wednesday’s hawkish tone from Cook continued to weigh on rate-cut expectations, gold’s rate-sensitive rally lost its underpinning, and it’s possible the stronger dollar into the close added pressure of its own.
Bitcoin drifted through a choppy, largely directionless session, swinging between a high near $64,900 and a low near $64,090 before settling little changed, down about 0.34% near $64,400. With no specific crypto headline driving the tape, the pullback from the day’s highs likely reflects the same risk-off undertone that weighed on equities, as traders broadly favored caution over the tech selloff and the still-unresolved Hormuz situation.
FX Market Behavior: U.S. Dollar vs. Majors
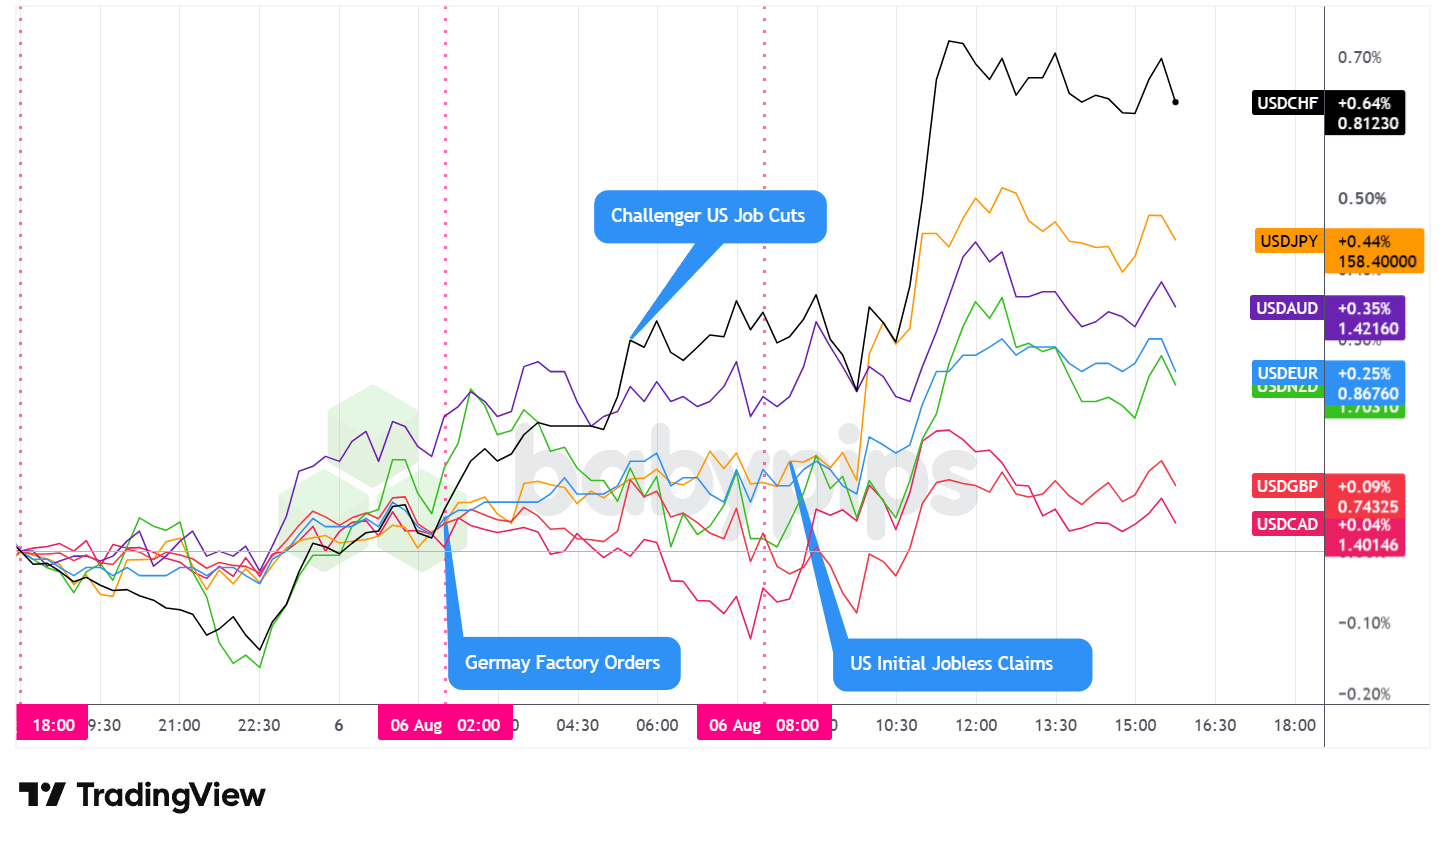
Overlay of USD vs. Major Currencies – Chart Faster With TradingView
The U.S. dollar chopped through a contained range for most of Thursday before pulling away from the pack late, closing as the best-performing major currency of the session, a reversal from Wednesday’s broadly weaker close.
During the Asian session, the dollar traded with low volatility, chopping mostly sideways with a mild bullish bias heading into the London open. Australia’s trade balance swung to a 1.93B surplus, beating the -1.8B forecast by a wide margin on a jump in exports, and building permits data also topped estimates, yet the Aussie could not sustain an early bid against a broadly firm dollar. Wednesday’s Fed commentary continued to color sentiment through the region’s hours. Neither Cook nor Daly signaled an imminent move, but the hawkish undertone in Cook’s remarks likely added modest support to the dollar even without a fresh headline to point to.
After the London session opened, the dollar continued slightly higher before quickly finding a top and pulling back heading into the U.S. open. European data leaned mixed over that window. Germany’s factory orders jumped 3.1% m/m, well above the 0.4% forecast, and both the euro area and U.K. construction PMIs beat expectations, yet euro area retail sales fell 0.3% m/m against a forecast for a 0.1% gain, and Swiss unemployment ticked up to 3.0%. None of it produced a clean directional push, and the dollar’s early bid faded without a specific London-session catalyst to sustain it.
Once the U.S. session opened, dollar volatility picked up and the greenback pushed net higher against the majors as a full slate of domestic data cleared the calendar. Challenger’s July report, the in-line jobless claims print, and the productivity and unit-labor-cost beats all pointed the same direction: a labor market holding up better than feared just a day before the more consequential July payrolls report. That reinforced the same inflation-and-yields story that carried oil higher through the same window. The dollar’s advance stabilized roughly after the London close, then eased back slightly against some of the majors and traded choppy through the rest of the day without giving up its net session gain.
At Thursday’s close, the dollar stood out as the best-performing major currency across the board, though the size of its gains varied widely. Its biggest advances came against the Swiss franc and the Japanese yen, both up more than 0.4%, an unusual pairing for a session otherwise marked by equity weakness and geopolitical tension, when havens like the franc and yen might normally be expected to hold their ground against the dollar. It’s possible the dollar’s own yield story, boosted by rising Treasury yields and the hawkish Fed tone, outweighed the typical haven bid for those two currencies on this particular day. The dollar’s smallest gain came against the Canadian dollar, up less than 0.05%, which may simply reflect oil’s sharp rally lending some separate support to the commodity-linked loonie.
Upcoming Potential Catalysts on the Economic Calendar
- Japan Household Spending for June 2026 at 11:30 pm GMT
- China Balance of Trade for July 2026 at 3:00 am GMT
- Japan Leading Economic Index Prel for June 2026 at 5:00 am GMT
- France Unemployment Rate for June 30, 2026 at 5:30 am GMT
- Germany Industrial Production for June 2026 at 6:00 am GMT
- Germany Balance of Trade for June 2026 at 6:00 am GMT
- Swiss Consumer Confidence for July 2026 at 7:00 am GMT
- U.K. BBA Mortgage Rate for July 2026 at 9:00 am GMT
- Canada Employment Situation Update for July 2026 at 12:30 pm GMT
- U.S. Employment Situation Update for July 2026 at 12:30 pm GMT
- Canada Ivey PMI for July 2026 at 2:00 pm GMT
- U.S. Fed Barkin Speech at 2:00 pm GMT
- U.S. Consumer Inflation Expectations for July 2026 at 3:00 pm GMT
Friday’s calendar is dominated by one release: the U.S. employment situation update for July, which will offer the clearest read yet on whether Thursday’s resilient labor data was a genuine trend or a one-off ahead of the more comprehensive report. Economists currently expect payrolls growth to accelerate to around 80,000 in July after June’s softer 57,000 increase, though Thursday’s stronger-than-feared Challenger and productivity numbers may tilt the risk toward an upside surprise.
Canada’s own employment report lands at the same time, adding a second layer of volatility risk for CAD specifically. Beyond the jobs data, a run of European releases, including German industrial production and trade figures, France’s unemployment rate, and Swiss consumer confidence, could shape the euro and franc heading into the weekend, while Fed’s Barkin closes out the day’s central bank commentary.
Stay frosty out there, forex friends!
Thursday’s market action showed how a crude oil spike rippled through Treasury yields, equities, and currency markets all at once. If you’re reading individual markets in isolation, you’re missing the real drivers of the move.
📖 What Is Intermarket Analysis?
Reading this helps you understand how moves transmit across asset classes, why oil shocks drive bond yields, and how yield changes ultimately reshape currency flows.
And if you’re not a Premium subscriber yet, now’s a good time to sign up.
With Babypips Premium, you get full access to School of Pipsology lessons that help you understand how oil shocks transmit into bond yields, how yield changes drive currency flows, and why looking at one market in isolation often blinds you to what’s actually driving price action.



