





A chip-led selloff pulled U.S. stocks lower on Thursday, and strong earnings from Taiwan Semiconductor failed to steady the sector. Renewed U.S. strikes on Iran and hawkish remarks from two Fed officials kept a lid on risk appetite. The dollar firmed against every major and closed as the day’s top performer.
Check out the forex news and economic updates you may have missed in the latest trading session!
Forex News Headlines & Data:
- Australia Consumer Inflation Expectations for July 2026: 4.7% (5.5% forecast; 5.5% previous)
- U.K. GDP for May 2026: 1.3% y/y (1.2% y/y forecast; 1.2% y/y previous)
- U.K. NIESR Monthly GDP Tracker for June 2026: 0.4% (0.2% forecast; 0.5% previous)
- Canada Housing Starts for June 2026: 239.0k (220.0k forecast; 261.4k previous)
- U.S. Initial Jobless Claims for July 11, 2026: 208.0k (216.0k forecast; 215.0k previous)
- NY Fed Services Activity Index for July 2026: 8.7 (-10.1 previous)
- Philadelphia Fed Manufacturing Index for July 2026: 41.4 (11.0 forecast; 10.3 previous)
- U.S. Retail Sales for June 2026: 6.7% y/y (6.7% y/y forecast; 6.9% y/y previous)
- U.S. NAHB Housing Market Index for July 2026: 34.0 (37.0 forecast; 35.0 previous)
- U.S. Pending Home Sales for June 2026: -0.3% y/y (2.3% y/y forecast; 4.8% y/y previous)
- U.S. Business Inventories for May 2026: 0.3% m/m (0.1% m/m forecast; 0.5% m/m previous)
- U.S. Retail Inventories Ex Autos for May 2026: 0.3% m/m (0.2% m/m forecast; 0.6% m/m previous)
Promoted: Scale Your Strategies in Volatile Markets
With chip stocks triggering a broader market selloff and renewed geopolitical tensions keeping risk assets on edge, navigating these unpredictable sessions requires more than a good entry—it requires a partner that has seen it all before.
While new firms come and go with the volatility, The5ers (4.7★ rating on 32K+ reviews) has spent the last 10 years perfecting a funding model that works for the trader. It’s why over 1.6 million traders worldwide trust them to provide the capital and scaling needed to turn market analysis into meaningful professional growth
Learn more about The5ers & available discounts
Disclosure: We may earn a commission from our partners if you sign up through our links, at no extra cost to you.
Broad Market Price Action:
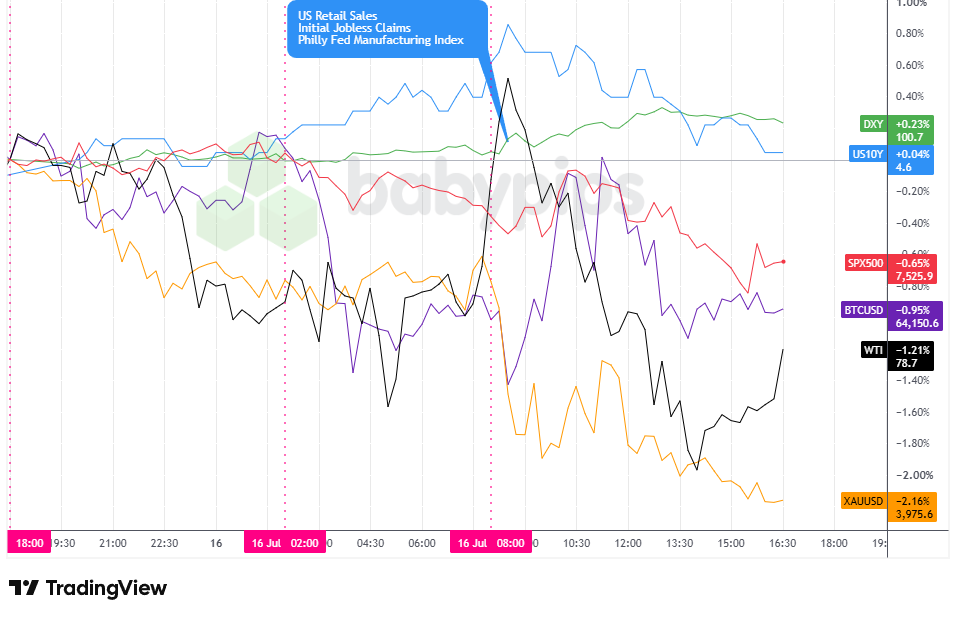
Dollar Index, Gold, Oil, S&P 500, U.S. 10-yr Yield, Bitcoin Overlay – Chart Faster With TradingView
The S&P 500 spent most of the session under pressure and settled down roughly 0.6% near 7,527. Buyers pushed the index back toward 7,570 late in the morning, but it rolled over again through the afternoon, dropped to a session low around 7,504, then recovered part of that ground into the close.
A semiconductor selloff drove the bulk of the damage. The higher spending forecast overshadowed a strong outlook from Taiwan Semiconductor, and the stock still fell more than 4%. Alphabet sank about 4.4% on reports that Google had slipped behind schedule on its flagship AI model, and the Nasdaq 100 shed around 1.6%.
Gold took the hardest hit of the major assets, sliding about 2.1% to around 3,978. The metal drifted lower through the Asia and London hours from near 4,066, then dropped after the U.S. open and bottomed close to 3,969. A firmer dollar and steady-to-higher real yields may have outweighed the safe-haven pull of the Middle East conflict, though that read is one possible explanation rather than a confirmed driver.
Crude spent the day giving back an early spike. WTI pushed toward 80.3 around the U.S. open on the fifth straight day of U.S. strikes against Iran, then faded to a low near 78.0 and settled around 78.2, down roughly 1.6% on the day but still elevated on the week. Bloomberg reported that observable traffic through the Strait of Hormuz stayed sparse, which kept a floor under prices even as the intraday move turned lower.
Bitcoin chopped sideways in a band between roughly 63,800 and 64,940 and finished near 64,150, down about 0.9%. With no crypto-specific catalyst on the tape, the risk-off tone across equities and the firmer dollar likely capped any attempt to rally.
The U.S. 10-year yield firmed toward 4.59% in the morning before easing back to around 4.56%, up a touch on the day. Geopolitical risk kept a floor under yields even after this week’s softer U.S. inflation data.
Promoted: When Geopolitics and Fed Speak Shift the Market, Is Your Account Ready?
Today’s session was a lesson in navigating mixed signals. The dollar caught a strong bid on hawkish comments from Fed officials, while a heavy semiconductor selloff dragged down equities. Trading these sharp risk-off turns on a small personal account, where a single stop-out stings, is a different game than trading with real backing behind you.
FTMO is a global prop firm with a 4.8★ rating on 40K+ reviews, serving traders since 2015! No time limits. Free trials. Up to $200K in Demo Capital.
Start a free trial with FTMO!
Disclosure: To help support our content, we may earn a commission from our partners if you sign up through our links, at no extra cost to you.
FX Market Behavior: U.S. Dollar vs. Majors
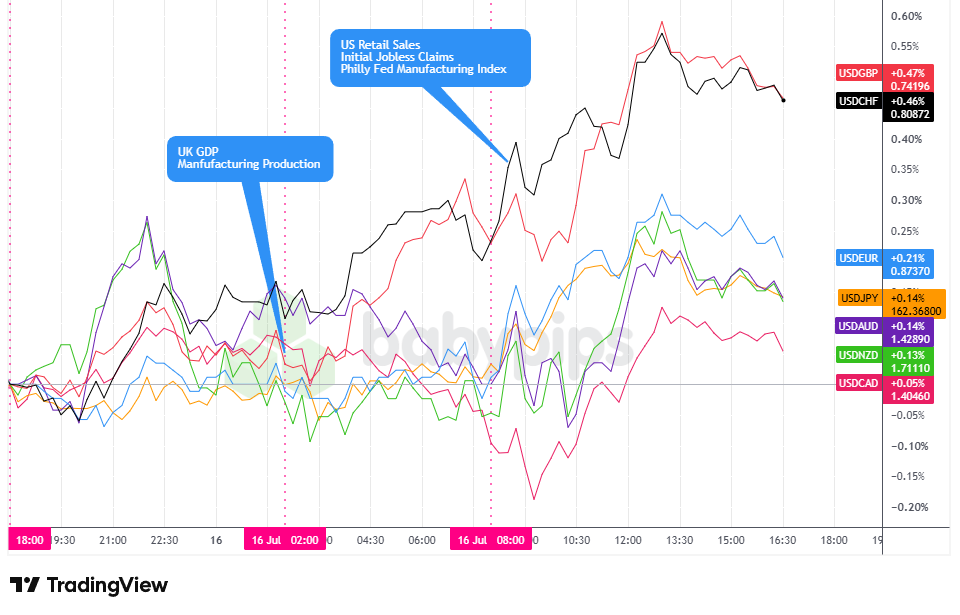
Overlay of USD vs. Majors – Chart Faster With TradingView
The dollar built on a quiet, mildly positive Asia session and carried a firm tone into the close. Through Asian hours the greenback traded sideways and held a slight net gain against the majors. London trading turned mixed with a modest bearish lean, and the dollar drifted for much of the European morning. That shifted after the U.S. open, when the greenback turned higher across the board and held those gains into the close as the day’s best-performing major. The U.S. Dollar Index tracked the same path, firming to an intraday high near 100.83 around midday in New York before easing to finish up about 0.2% near 100.7.
The dollar’s U.S.-session bid lined up with the broader move out of risk. Hawkish Fed commentary added to the pull: Kansas City Fed President Jeff Schmid flagged inflation as his biggest concern, and Dallas Fed President Lorie Logan called for higher rates. A solid data slate reinforced the tone, with jobless claims falling to 208k, the Philadelphia Fed manufacturing index jumping to 41.4, and retail sales coming in mixed but consistent with a consumer that keeps spending.
The gains were not even. The dollar climbed most against the pound, up roughly 0.5%, with the Swiss franc close behind. An argument could be made that part of sterling’s slide reflected profit-taking after the pound’s more-than-1% jump the prior day rather than fresh dollar strength alone. Moves against the euro were more contained near 0.2%, while the Australian dollar, yen, and New Zealand dollar each gave up something in the region of 0.15%. The Canadian dollar proved the most resilient, possibly helped by crude’s earlier strength before oil rolled over later in the session.
Promoted: The Setup Is Only Half the Job. The Other Half Is Coaching Yourself Through It.
Sessions like today’s test discipline more than analysis. Getting caught flat-footed by the sudden semiconductor selloff, or second-guessing the dollar’s sharp U.S.-session surge on hawkish Fed comments, is exactly where a good plan falls apart. In “The Daily Trading Coach” by Brett Steenbarger, the market psychologist lays out 101 practical lessons for becoming your own trading coach. Learn to manage your emotions, review your own decisions, and execute with consistency when geopolitical headlines and risk-off moves whip price around.
Click on the link to learn more about “The Daily Trading Coach” by Brett Steenbarger!
Disclosure: We may earn a commission from our partners if you sign up through our links, at no extra cost to you.
Upcoming Potential Catalysts on the Economic Calendar
- Fed Logan Speech at 4:30 pm GMT
- New Zealand Food Price Index for June 2026 at 10:45 pm GMT
- Fed Jefferson Speech at 11:00 pm GMT
- Euro area Current Account for May 2026 at 8:00 am GMT
- Euro area CPI Growth Rate Final for June 2026 at 9:00 am GMT
- Canada CFIB Business Barometer for July 2026 at 11:00 am GMT
- Canada Foreign Securities Purchases for May 2026 at 12:30 pm GMT
- U.S. Building Permits Prel for June 2026 at 12:30 pm GMT
- U.S. Import & Export Prices for June 2026 at 12:30 pm GMT
- U.S. Industrial & Manufacturing Production for June 2026 at 1:15 pm GMT
- Michigan Inflation Expectations Prel for July 2026 at 2:00 pm GMT
- University of Michigan Consumer Sentiment Index for July 2026 at 2:00 pm GMT
Attention now shifts to whether the chip sector can find a floor, since its fragility set the tone for the whole tape on Thursday. A sustained rebound in semiconductors would ease pressure on the broader indices, while another leg lower could keep risk appetite subdued and the dollar bid. Oil and the Iran conflict stay a live wildcard for both crude and yields, and the hawkish tilt from Fed speakers this week leaves the market sensitive to any upside surprise in inflation data. Friday’s University of Michigan survey, and its preliminary inflation expectations reading in particular, is the next U.S. catalyst worth watching on that front.
Stay frosty out there, forex friends!
Today’s market showed a textbook example of how economic data hits and immediately triggers a cascade of reactions across currencies, equities, and commodities. Premium members can read our lesson:
📖 From Data to Price Action: What Happens When Big News Hits
Reading this helps you understand the mechanics of how data moves price, why the initial algorithmic spike is not where the real opportunity begins, and what traps catch traders who chase the first move.
And if you’re not a Premium subscriber yet, consider joining.
With Babypips Premium, you get full access to School of Pipsology lessons that help you understand how economic data actually moves currency prices, and why most traders chase the spike and get destroyed in the spread instead of trading the real opportunity that comes after.



