





A softer-than-expected U.S. producer price report cooled bets on a near-term Fed rate hike, pulling the dollar and Treasury yields lower and lifting stocks for a second straight day. The escalating U.S.-Iran conflict kept a firm bid under oil and lent gold a late safe-haven lift, while the British pound stood out as the day’s strongest gainer against the greenback.
Check out the forex news and economic updates you may have missed in the latest trading session!
Forex News Headlines & Data:
- API Crude Oil Stock Change for July 10, 2026: -0.06M (-0.4M previous)
- Japan Reuters Tankan Index for July 2026: 13.0 (14.0 forecast; 13.0 previous)
- Japan Machinery Orders for May 2026: -1.9% y/y (16.0% y/y forecast; 15.6% y/y previous)
-
China GDP Growth Rate for Q2 2026: 4.3% y/y (4.6% y/y forecast; 5.0% y/y previous); 0.9% q/q (1.0% q/q forecast; 1.3% q/q previous)
- China Industrial Production for June 2026: 5.3% y/y (5.0% y/y forecast; 4.5% y/y previous)
- China Retail Sales for June 2026: 1.0% y/y (0.2% y/y forecast; -0.6% y/y previous)
- China Unemployment Rate for June 2026: 5.0% (5.1% forecast; 5.1% previous)
- China New Loans for June 2026: 1,610.0B (2,000.0B forecast; 520.0B previous)
- China M2 Money Supply for June 2026: 8.0% (8.5% forecast; 8.6% previous
- Euro area Industrial Production for May 2026: -1.2% (0.1% forecast; 0.3% previous); -0.2% m/m (0.3% m/m forecast; 0.1% m/m previous)
- U.S. MBA 30-Year Mortgage Rate for July 10, 2026: 6.65% (6.58% previous)
- Canada Wholesale Sales Final for May 2026: 0.0% m/m (-0.7% m/m forecast; 0.6% m/m previous)
- Canada Manufacturing Sales Final for May 2026: 1.3% m/m (1.1% m/m forecast; 4.2% m/m previous)
- U.S. Producer Prices Index Growth Rate for June 2026: 5.5% y/y (6.3% y/y forecast; 6.5% y/y previous)
- U.S. NY Empire State Manufacturing Index for July 2026: 15.6 (6.2 forecast; 5.7 previous)
- Bank of Canada Interest Rate Decision for July 15, 2026: 2.25% (2.25% forecast; 2.25% previous)
- EIA Crude Oil Stocks Change for July 10, 2026: -1.69M (3.0M previous)
Promoted: Scale Your Strategies
A softer-than-expected CPI print sent the dollar to the bottom of the majors on Tuesday, only for Warsh’s testimony to claw part of the move back within hours. Navigating whipsaws like that requires more than a good entry, it requires a partner that has seen it all before.While new firms come and go with the volatility, The5ers (4.7★ rating on 32K+ reviews) has spent the last 10 years perfecting a funding model that works for the trader. It’s why over 1.6 million traders worldwide trust them to provide the capital and scaling needed to turn market analysis into meaningful professional growth.
Learn more about The5ers & available discounts
Disclosure: We may earn a commission from our partners if you sign up through our links, at no extra cost to you.
Broad Market Price Action:
Dollar Index, Gold, Oil, S&P 500, U.S. 10-yr Yield, Bitcoin Overlay – Chart Faster With TradingView
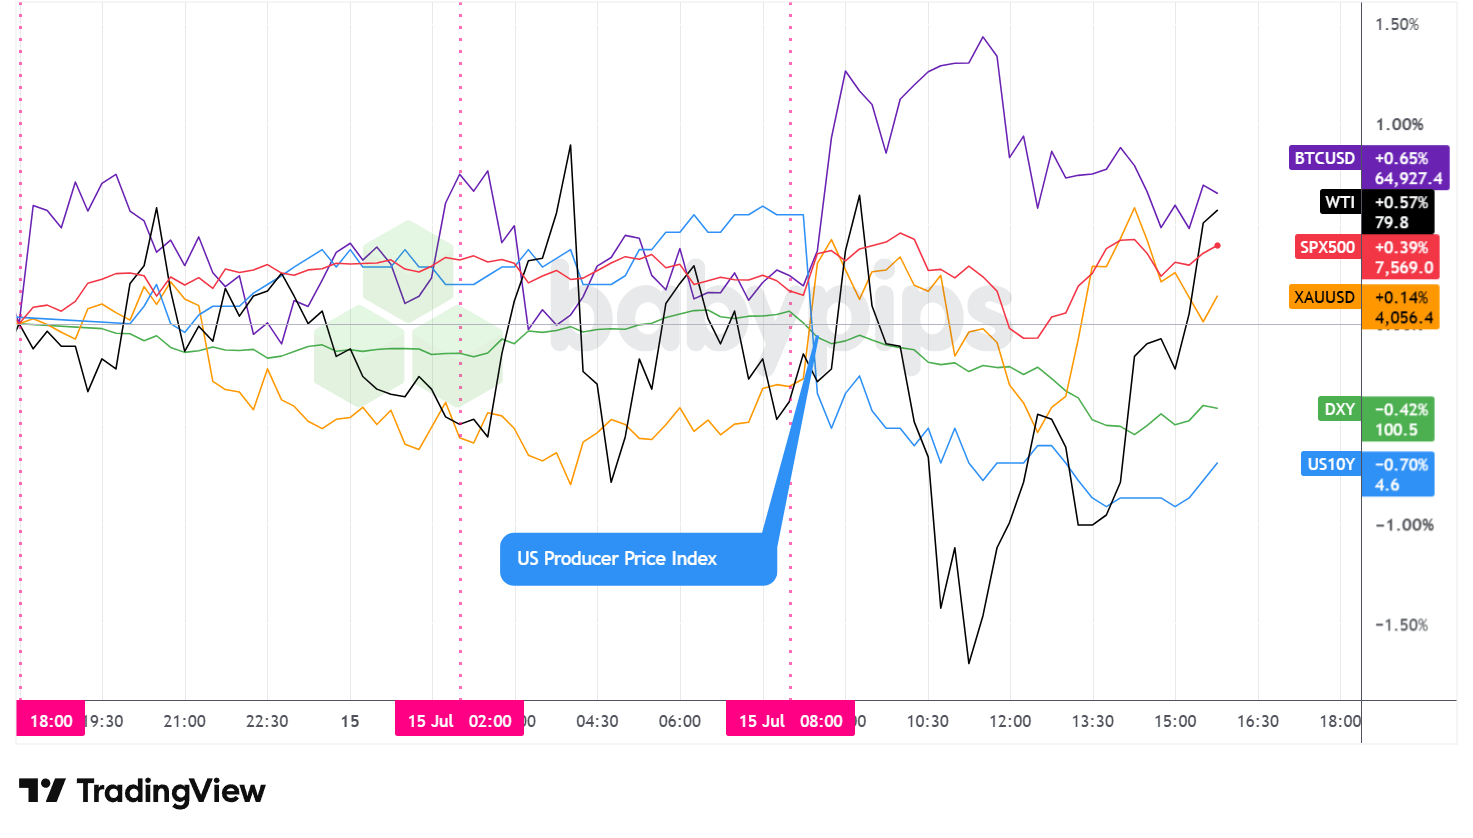
Wednesday split around the U.S. producer price release, with risk assets grinding higher into the report, wobbling on the follow-through, then recovering into the close as the softer inflation read did most of the day’s work.
The S&P 500 finished up around 0.4%, ending near 7,569 for a second consecutive daily gain. Price traded in a tight band through the Asian and London sessions before pushing to a session high near 7,581 in the first hour of U.S. cash trade. Sellers then took the index down to an intraday low near 7,527 around midday, after which buyers stepped back in and carried it into the close. The recovery leaned on the cooler PPI print and a run of upbeat bank earnings, though a gauge of chipmakers lagged the broader tape.
WTI crude closed higher by around 0.6%, settling near $79.80 a barrel. Oil chopped in a roughly two-dollar range for most of the day, dipping to a low near $77.80 around late morning before recovering to test the $80 handle late in the session. The bid likely reflected the ongoing U.S.-Iran conflict and the resumed naval blockade near the Strait of Hormuz, with a 1.69 million barrel EIA inventory draw adding support.
Gold ended with a slim gain of around 0.1%, closing near $4,056 an ounce. The metal sagged through the Asian session to a low near $4,020 before finding its footing, then rallied to a session high near $4,081 in the afternoon as the dollar rolled over, giving some of that back into the close. With no gold-specific catalyst on the wires, the advance most likely reflected the softer dollar and steady safe-haven demand tied to Middle East tensions.
The 10-year Treasury yield eased on the day, settling around 4.55%. Yields drifted higher into the U.S. open before the PPI report knocked them lower, with the 10-year sliding to a low near 4.54% through the afternoon. The move fit the softer-inflation narrative, as traders pared back expectations for a Fed hike this year and short-dated Treasuries outperformed. It’s worth noting that the Fed’s Beige Book, released later in the session, described activity expanding at a slight-to-moderate pace with prices rising moderately, a read that did little to challenge the day’s dovish repricing.
Bitcoin firmed by around 0.65%, closing near $64,927. The coin ranged through the overnight hours, spiked to a session high near $65,559 around midday, then drifted back toward the mid-64,000s into the close. With no crypto-specific driver to point to, the move likely rode the same risk-on impulse that followed the softer U.S. inflation data and the accompanying slide in the dollar.
Promoted: When One Data Point Whipsaws the Whole Market, Is Your Account Ready?
Today’s session was a lesson in fast reversals. The dollar firmed into the U.S. open, then rolled over hard once the softer June PPI hit the tape, while oil stayed bid on Middle East headlines. Trading those turns on a small account, where a single stop-out stings, is a different game than trading with real backing behind you. FTMO is a global prop firm with a 4.8★ rating on 40K+ reviews, serving traders since 2015! No time limits. Free trials. Up to $200K in Demo Capital.
Start a free trial with FTMO!
Disclosure: To help support our content, we may earn a commission from our partners if you sign up through our links, at no extra cost to you.
FX Market Behavior: U.S. Dollar vs. Majors
Overlay of USD vs. Majors – Chart Faster With TradingView
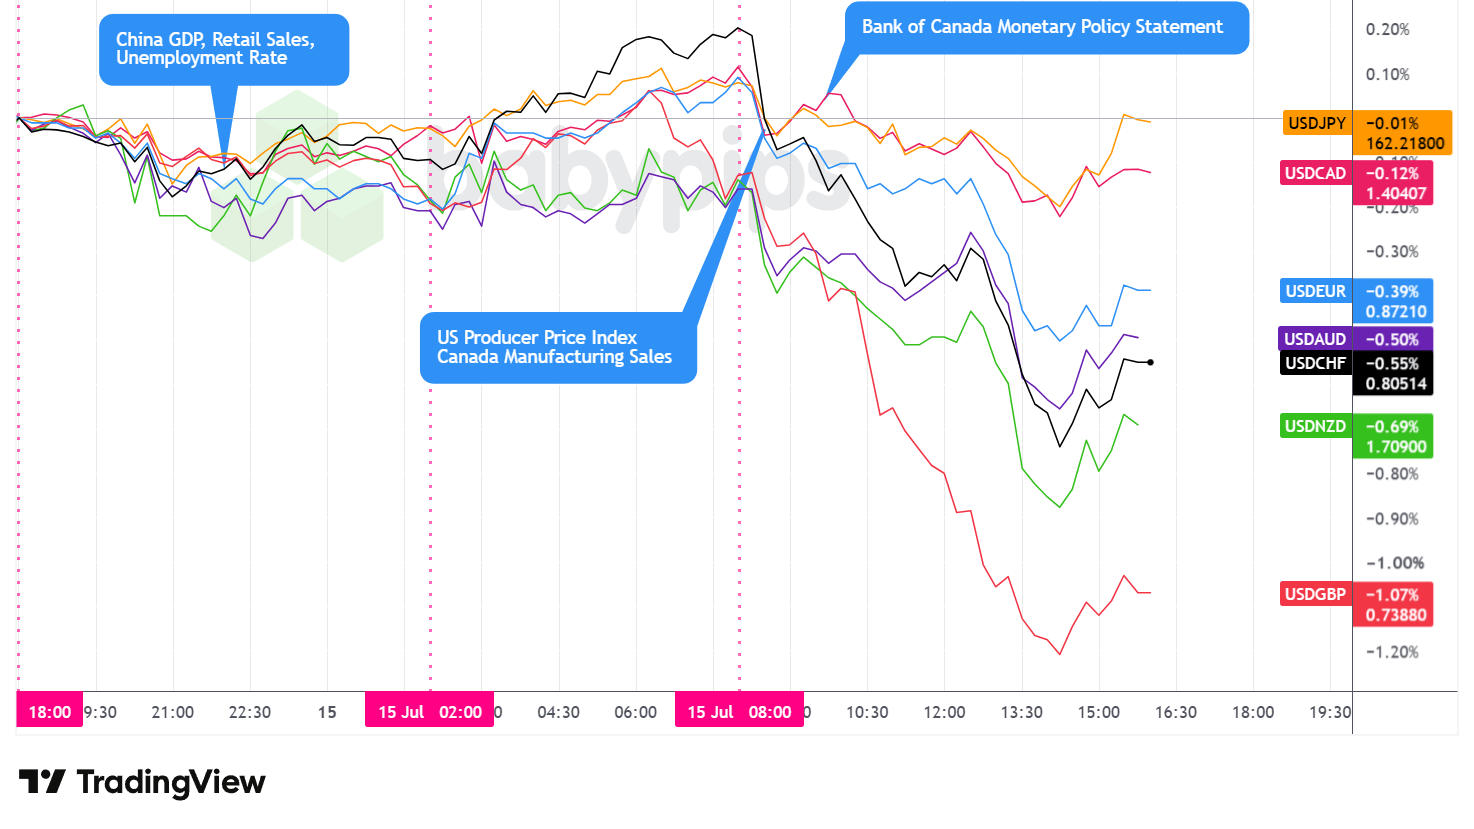
The U.S. dollar spent Wednesday on the back foot, giving ground against most majors in a session that turned lower once the soft producer price report hit the tape.
During the Asian session, the dollar dipped against the majors but traded with low volatility, drifting mostly sideways into the London open as the Dollar Index hovered in the high-100.7s to low-100.9s. There was little fresh currency-specific news to trade on, with China’s mixed data dump, a weaker Q2 GDP print alongside firmer June retail sales and industrial output, generating limited direct dollar reaction.
After the London open, the dollar recouped some of those losses and firmed against the majors, with the Dollar Index climbing to a session high near 101.02 in the hours ahead of the U.S. open. The recovery ran out of road once U.S. trade got underway. The softer-than-expected June PPI, which showed the headline rate cooling to 5.5% year-over-year and the monthly figure turning negative, drove the dollar lower on net across the majors and sent the Dollar Index down toward a low near 100.36 by the early-to-mid afternoon. The greenback then stabilized just ahead of the close and managed a minor rebound, ending the day near 100.51 for a loss of around 0.4%.
At the close, the dollar was lower against the majors on net, holding up best against the Japanese yen, where it finished close to flat near 162.22. The biggest mover was the British pound, which gained around 1.1% against the dollar. An argument could be made that Chancellor Reeves’ Mansion House address, layered on top of the broadly softer dollar and firmer risk appetite, helped sterling outperform, though the exact driver is hard to pin down. The New Zealand dollar, Swiss franc, Australian dollar, and euro all posted more moderate gains against the greenback.
The Canadian dollar was a laggard among the winners, firming only marginally as the Bank of Canada held its policy rate at 2.25%, matching expectations. With no surprise in the decision, the loonie’s reaction stayed muted, and softer Canadian manufacturing sales left that read intact.
Promoted: The Setup Is Only Half the Job. The Other Half Is Coaching Yourself Through It.
Sessions like today’s test discipline more than analysis. Chasing the dollar’s London bounce right before the PPI reversal, or freezing on sterling’s breakout, is exactly where a good plan falls apart. In “The Daily Trading Coach” by Brett Steenbarger, the market psychologist lays out 101 practical lessons for becoming your own trading coach, so you can manage emotion, review your own decisions, and execute with consistency when a single news print whips price around.
Click on the link to learn more about “The Daily Trading Coach” by Brett Steenbarger!
Disclosure: We may earn a commission from our partners if you sign up through our links, at no extra cost to you.
Upcoming Potential Catalysts on the Economic Calendar
- Fed Musalem Speech at 10:30 pm GMT
- Australia Consumer Inflation Expectations for July 2026 at 1:00 am GMT
-
U.K. GDP for May 2026 at 6:00 am GMT
- U.K. Manufacturing Production for May 2026 at 6:00 am GMT
- Swiss SNB Monetary Policy Meeting Minutes at 7:30 am GMT
- Canada Housing Starts for June 2026 at 12:15 pm GMT
- Philadelphia Fed Manufacturing Index for July 2026 at 12:30 pm GMT
- U.S. Retail Sales for June 2026 at 12:30 pm GMT
- NY Fed Services Activity Index for July 2026 at 12:30 pm GMT
- U.S. Initial Jobless Claims for July 11, 2026 at 12:30 pm GMT
- U.S. NAHB Housing Market Index for July 2026 at 2:00 pm GMT
- U.S. Pending Home Sales for June 2026 at 2:00 pm GMT
- Fed Logan Speech at 4:30 pm GMT
- New Zealand Food Price Index for June 2026 at 10:45 pm GMT
- U.S. Fed Jefferson Speech at 11:00 pm GMT
Thursday’s calendar puts the U.S. consumer front and center. June retail sales at 12:30 GMT headline the session, arriving alongside weekly jobless claims, the Philadelphia Fed manufacturing index, and the NY Fed services gauge. After Wednesday’s soft PPI cooled bets on a near-term Fed hike, a weak retail read would reinforce that dovish repricing, while an upside surprise could revive the case for tighter policy later this year.
The London morning brings a cluster of U.K. releases, including May GDP and industrial and manufacturing production, which should hand sterling its next test after Wednesday’s outperformance.
Swiss National Bank’s meeting minutes and a run of Fed speakers round out the docket, and the U.S.-Iran conflict remains an any-time wildcard with the scope to override the scheduled data.
Stay frosty out there, forex friends!
Today’s softer-than-expected producer price report shows exactly what happens when major economic data hits the market. Most readers only see the final result, but understanding the mechanism that drives it requires knowing how data flows through the market in two distinct stages.
📖 From Data to Price Action: What Happens When Big News Hits
Reading this helps you understand the algorithmic spike that hits first, the secondary analytical move that follows, and the common traps that catch traders who don’t expect both.
And if you’re not a Premium subscriber yet, consider joining.
With Babypips Premium, you get full access to School of Pipsology lessons that help you understand not just what the price is doing, but the precise mechanism behind how economic data becomes price action.



