





Renewed violence in the Strait of Hormuz dominated Tuesday’s session after the U.S. Treasury revoked a waiver that had allowed the sale of Iranian oil, sending crude sharply higher and lifting Treasury yields on fresh inflation worries. Equities leaned lower as a slide in chipmakers pressured the tech-heavy indexes, though rotation into other sectors kept the S&P 500’s loss modest. The dollar firmed against most majors, while gold slipped despite the geopolitical flare-up.
Check out the forex news and economic updates you may have missed in the latest trading session!
Forex News Headlines & Data:
- Japan Household Spending for May 2026: -0.4% y/y (-2.1% y/y forecast; -0.5% y/y previous)
- Japan Average Cash Earnings for May 2026: 3.2% y/y (3.6% y/y forecast; 3.5% y/y previous)
- Japan Leading Economic Index Prel for May 2026: 116.8 (116.3 forecast; 116.1 previous)
- Germany Industrial Production for May 2026: 0.9% m/m (0.2% m/m forecast; 0.4% m/m previous)
- U.K. Lloyds House Price Index for June 2026: 0.6% y/y (0.3% y/y forecast; 0.5% y/y previous)
- France Balance of Trade for May 2026: -6.9B (-6.3B forecast; -5.6B previous)
- Bank of England Financial Stability Report: the UK banking system remains resilient, but it flags rising risks from stretched equity valuations, higher investor leverage, AI-related vulnerabilities, and cyber/operational risks. It also set out plans to ease some bank leverage rules, which it says could support lending and government bond demand, while still reviewing whether those changes would leave any stability gaps.
- U.S. ADP Employment Change Weekly for June 20, 2026: 21.0k (30.75k previous)
- Canada Balance of Trade for May 2026: 4.24B (2.0B forecast; 2.72B previous)
- U.S. Balance of Trade for May 2026: -77.6B (-80.0B forecast; -55.9B previous)
- Canada Ivey PMI s.a for June 2026: 56.2 (58.7 forecast; 58.2 previous)
- The U.S. Treasury revoked a waiver that had allowed the sale of Iranian oil after attacks on tankers in the Strait of Hormuz, with no new transactions permitted on or after July 7
- Federal Reserve Bank of New York President John Williams expects falling energy prices to drive a drop in overall inflation over the next few months.
Promoted: Scale Your Forex Strategies
As persistent inflation and shifting central bank policies whipsaw traders, navigating the current macro landscape requires more than just a good entry—it requires a partner that has seen it all before.While new firms come and go with the volatility, The5ers (4.7★ rating on 32K+ reviews) has spent the last 10 years perfecting a funding model that works for the trader. It’s why over 1.6 million traders worldwide trust them to provide the capital and scaling needed to turn market analysis into meaningful professional growth.
Learn more about The5ers & available discountsDisclosure: We may earn a commission from our partners if you sign up through our links, at no extra cost to you.
Broad Market Price Action:
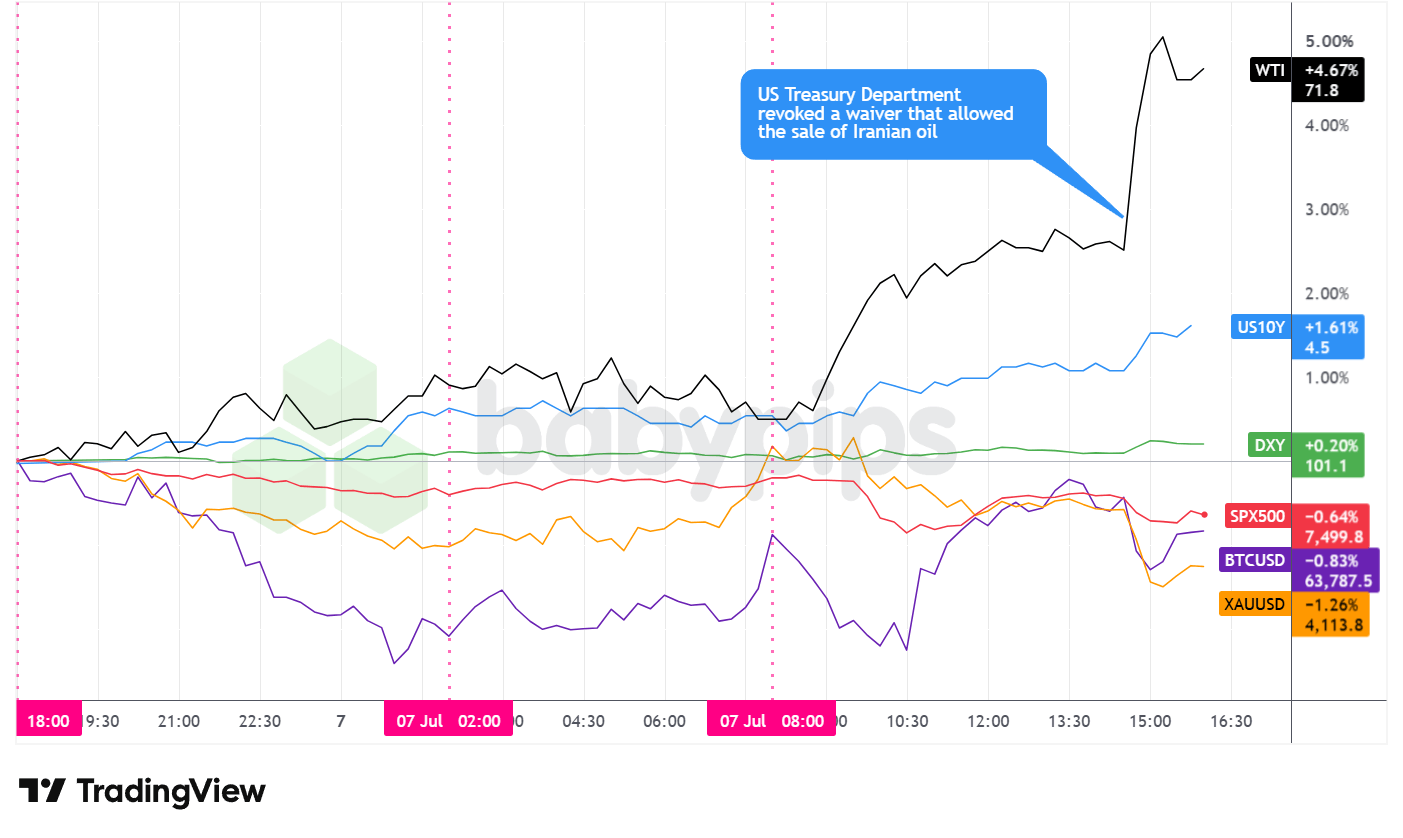
Dollar Index, Gold, Oil, S&P 500, U.S. 10-yr Yield, Bitcoin Overlay – Chart Faster With TradingView
WTI crude was the session’s standout, rallying roughly 4.7% to around $71.80. The advance built gradually through the morning before a sharp spike in the early afternoon, a move that lined up with the Treasury’s revocation of the Iranian oil waiver and the renewed threat to shipping through the Strait of Hormuz. Crude briefly pushed toward $72.30 before easing back.
The S&P 500 eased roughly 0.6% to around 7,500, holding up better than the tech-heavy gauges. A gauge of semiconductor firms fell about 4.6% on the day and the Nasdaq 100 dropped near 1.8%, reflecting concern over whether heavy artificial-intelligence spending can justify current valuations. Most S&P 500 members still rose, which suggests money rotated into other sectors rather than leaving equities altogether. Price action was choppy, with the index sliding toward 7,478 in the first hour of U.S. trading before recovering to roughly 7,520 and drifting lower into the close.
Gold slipped roughly 1.3% to around $4,114, easing from a two-week high near $4,180. The decline stands out given the geopolitical backdrop, since bullion often attracts safe-haven demand during such flare-ups. The pullback possibly reflected a firmer dollar and rising Treasury yields, both of which tend to weigh on the non-yielding metal, with the sharpest drop coming in the U.S. afternoon before a modest bounce off the $4,092 area.
The 10-year Treasury yield climbed to around 4.50%, up roughly 1.6% on the day. Yields pushed higher through the afternoon as the jump in oil revived inflation concerns, since costlier energy can feed into headline price pressures. The move complicated an upbeat message from New York Fed President John Williams, who said earlier in the day that falling energy prices should help bring inflation down over the coming months and that monetary policy remains well positioned. The afternoon surge in crude cut against that near-term energy view within hours.
Bitcoin eased roughly 0.8% to around $63,800. The cryptocurrency dipped toward $62,600 in late morning before recovering through the afternoon and settling in the mid-$63,000s. With no crypto-specific catalyst on the day, the price action likely tracked the same caution over energy-driven inflation and stretched tech valuations that shaped the rest of the session.
Promoted: Profitable Trading Isn’t Reserved for Wall Street.
Most traders quietly wonder if consistent profitability is actually achievable for someone like them—or if it’s just a story people tell. Jack Schwager’s newest book, “Market Wizards: The Next Generation,” answers that question directly. The legendary author behind the original Market Wizards series interviews a new generation of successful traders—many self-taught—who built real wealth and income through the markets. Their common thread isn’t genius or insider access. It’s a deliberate process, disciplined risk management, and the conviction to take trading seriously as a pursuit worth mastering.
If that sounds like something worth exploring, this is a good place to start.
Get Market Wizards: The Next Generation on Amazon!
Disclosure: We may earn a commission from our partners if you sign up through our links, at no extra cost to you.
FX Market Behavior: U.S. Dollar vs. Majors
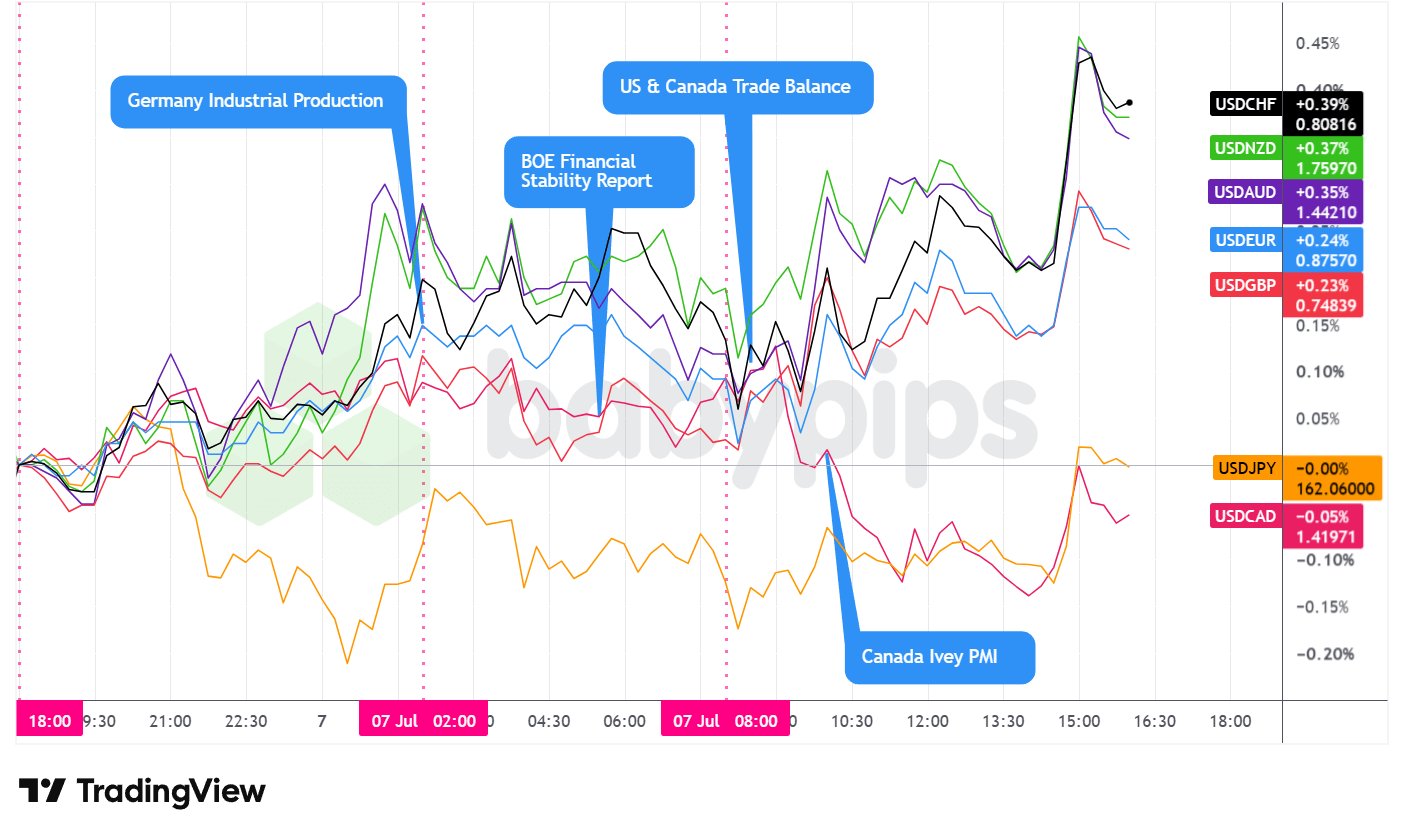
Overlay of USD vs. Majors – Chart Faster With TradingView
The U.S. dollar firmed on Tuesday, closing mixed but with an arguably strong net bullish lean against the majors. The Dollar Index rose around 0.2% to near 101.06, and the greenback gained ground against most major currencies, slipping only against the Canadian dollar and closing basically flat against the yen.
From the Asian open through the London open, the dollar traded net higher against the majors. Japanese data came in mixed, with household spending beating forecasts while average cash earnings undershot, and broader markets held a cautious tone as the escalation in the Strait of Hormuz set the overnight mood.
Through the morning London session, the dollar pulled back slightly on net. Stronger-than-expected German industrial production, which rose 0.9% against a 0.2% forecast, offered a modest lift to the euro, while UK house prices also surprised to the upside. The Bank of England’s Financial Stability Report landed during the session, judging the banking system resilient while flagging risks from stretched equity valuations and rising leverage. ECB policymaker Panetta warned that the latest energy shock should not be treated as temporary, a message that reinforced a cautious European inflation backdrop.
From the U.S. open through the rest of the day, the dollar traded mixed but arguably net positive. U.S. and Canadian trade balance figures and a softer Canada Ivey PMI passed with limited directional follow-through. The dollar then firmed into the afternoon, with the Dollar Index pushing toward 101.13 around the time crude spiked on the Iranian oil news.
At the close, the dollar was mixed but arguably strongly net bullish, holding gains against the franc, kiwi, Aussie, euro, and pound, flat against the yen, all while posting a slight loss against the Canadian dollar. The loonie’s relative resilience likely owed something to the surge in oil, given Canada’s role as a major crude exporter, while the yen’s steadiness possibly reflected safe-haven demand as equities wobbled.
Promoted: Keep Your Automated Edge Running 24/7.
Your algorithmic strategy shouldn’t rely on your home Wi-Fi. In high-volatility events, execution speed and uptime are what separate a winning backtest from a live market success. ForexVPS provides ultra-low latency, dedicated trading servers that keep your algos executing trades around the clock without interruption. Stop letting connectivity issues erode your edge.
Explore VPS plans at ForexVPS!
Disclosure: To help support our free daily content, we may earn a commission from our partners if you sign up through our links, at no extra cost to you.
Upcoming Potential Catalysts on the Economic Calendar
- U.S. API Crude Oil Stock Change for July 3, 2026 at 8:30 pm GMT
- Japan Bank Lending for June 2026 at 11:50 pm GMT
- Australia RBA Hunter Speech at 1:00 am GMT
- Australia Building Permits Final for May 2026 at 1:30 am GMT
- RBNZ Interest Rate Decision for July 8, 2026 at 2:00 am GMT
- Japan Eco Watchers Survey Outlook for June 2026 at 5:00 am GMT
- U.S. MBA 30-Year Mortgage Rate for July 3, 2026 at 11:00 m GMT
- U.S. Wholesale Inventories for May 2026 at 2:00 pm GMT
- U.S. EIA Crude Oil Stocks Change for July 3, 2026 at 2:30 pm GMT
- U.S. FOMC Minutes at 6:00 pm GMT
- U.S. Consumer Credit Change for May 2026 at 7:00 pm GMT
Wednesday’s calendar centers on the RBNZ rate decision during the Asian session and the June FOMC minutes during U.S. hours. With investors recently leaning toward the possibility of a Fed hike later this year, the minutes could offer clues on how officials are weighing energy-driven inflation risks against the growth outlook, a debate that Tuesday’s renewed jump in oil made more pressing. The EIA crude inventory report will also likely draw attention given the fresh Strait of Hormuz tensions.
Stay frosty out there, forex friends!
When oil spikes on geopolitical tension, equities sell off, yields climb, and currencies whip around all at once, you’re watching multiple asset classes move in sync. Premium members can read our lesson:
📖 Equities and Currencies: The Big Picture
Reading this helps you understand how equity market weakness transmits into currency moves, which stock indices matter most to FX traders, and how to use the equity-currency relationship to validate your trade thesis before you risk capital.
And if you’re not a Premium subscriber yet, consider joining.
With Babypips Premium, you get full access to School of Pipsology lessons that help you understand not just what’s moving today, but the cross-asset mechanisms driving those moves.



