


The U.S. dollar climbed to its strongest level since November on Tuesday as traders leaned into expectations that the Federal Reserve will raise interest rates later this year, while a steep selloff in technology shares dragged equities, Bitcoin, and gold lower. The greenback finished as the best-performing major currency, posting its largest gains against the risk-sensitive Australian and New Zealand dollars.
Check out the forex news and economic updates you may have missed in the latest trading session!
Forex News Headlines & Data:
- Yen Intervention Prospect Rises After Katayama-Bessent Talks
- President Donald Trump said funds released from Iran’s frozen accounts will stay under U.S. control and be spent only on American food and medical supplies.
- Traffic through the Strait of Hormuz kept recovering, with seven tankers crossing or already through the waterway while broadcasting their positions, a sign of firmer confidence that Iran will refrain from targeting vessels.
- Australia S&P Global Manufacturing PMI Flash for June 2026: 51.2 (50.0 forecast; 50.7 previous)
- Australia S&P Global Services PMI Flash for June 2026: 49.9 (49.0 forecast; 48.7 previous)
- Japan S&P Global Services PMI Flash for June 2026: 51.8 (50.3 forecast; 50.0 previous)
- Japan S&P Global Manufacturing PMI Flash for June 2026: 54.9 (53.6 forecast; 54.5 previous)
- Swiss Current Account for March 31, 2026: 15.5B (11.9B forecast; 7.0B previous)
- Euro area S&P Global Manufacturing PMI Flash for June 2026: 51.3 (51.1 forecast; 51.6 previous)
- Euro area S&P Global Services PMI Flash for June 2026: 48.9 (48.4 forecast; 47.7 previous)
- U.K. S&P Global Manufacturing PMI Flash for June 2026: 53.1 (53.4 forecast; 53.9 previous)
- U.K. S&P Global Services PMI Flash for June 2026: 48.7 (49.7 forecast; 49.3 previous)
- U.S. ADP Employment Change Weekly for June 6, 2026: 30.75k (25.5k previous)
- On Tuesday, Bank of Canada Governor Tiff Macklem discussed on how global financial risks and uneven trade and investment can interact with existing imbalances to threaten the international financial system, and he argues that policy and regulatory adjustments are needed to bolster the system’s resilience and support sustainable growth
-
U.S. S&P Global Manufacturing PMI Flash for June 2026: 55.7 (54.5 forecast; 55.1 previous)
- U.S. S&P Global Services PMI Flash for June 2026: 51.3 (50.9 forecast; 50.7 previous)
- Richmond Fed Manufacturing Index for June 2026: 4.0 (7.0 forecast; 13.0 previous)
- U.S. Money Supply for May 2026: 23.05 (22.8 previous)
Promotion: If your confidence has grown in your market awareness & strategies, and you wanna take action, Maven Trading can help. They provide simulated funding challenges starting as low as $15, allowing you to trade major pairs with professional-sized capital. No time limits mean you can take swing plays on these market themes without the pressure of a ticking clock.
Learn More About Maven Trading Today! And for a limited time: Use code “ETERNAL” for 10% off Challenge fee!
Disclosure: We may earn a commission from our partners if you sign up through our links, at no extra cost to you.
Broad Market Price Action:
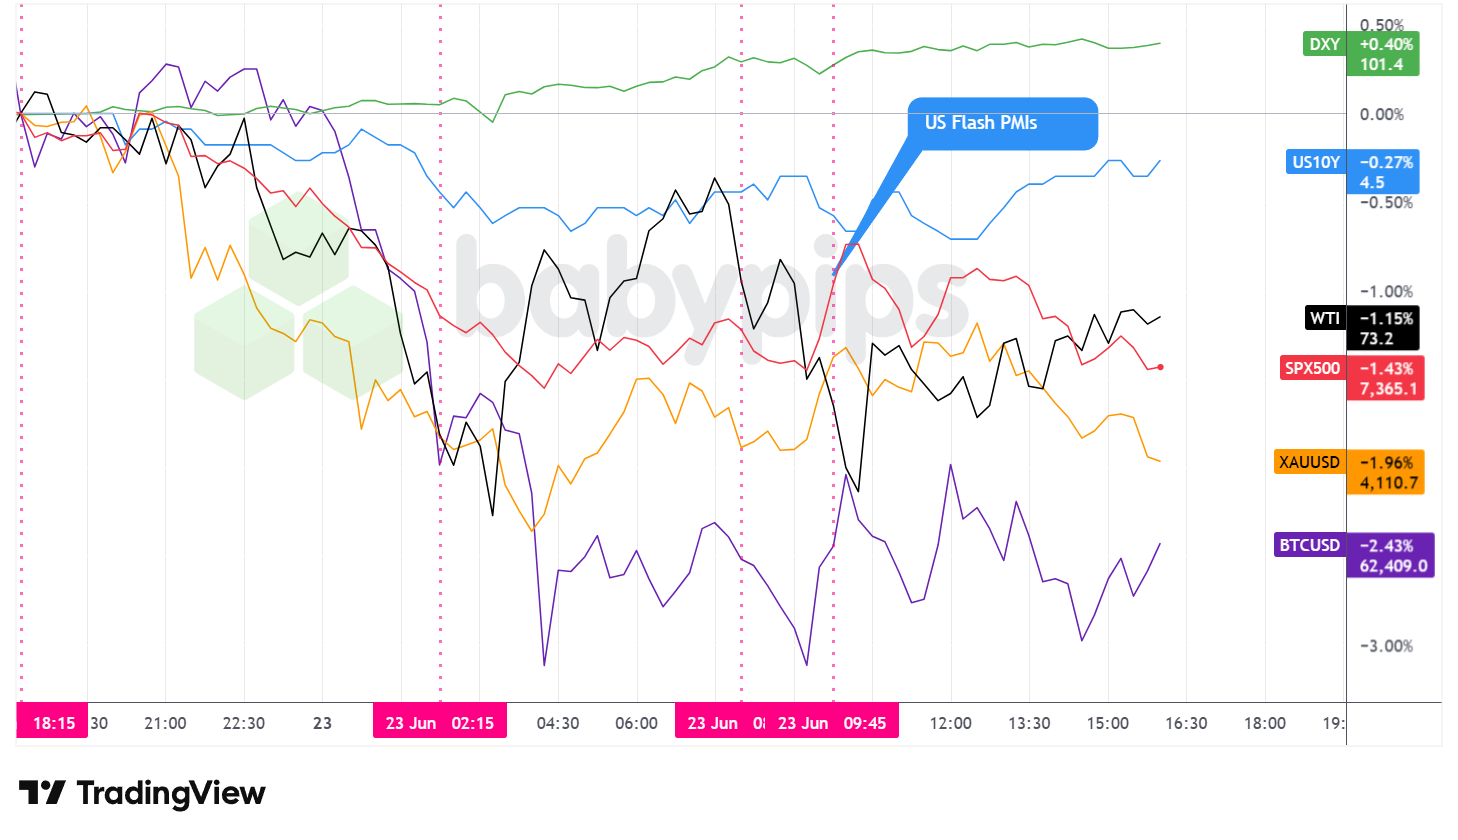
Dollar Index, Gold, Oil, S&P 500, U.S. 10-yr Yield, Bitcoin Overlay – Chart Faster With TradingView
Tuesday’s session turned risk-off as a sharp selloff in technology shares revived doubts about stretched artificial-intelligence valuations. The rout started in South Korea, where the Kospi tumbled roughly 10% from a record, then spread through global chipmakers and U.S. megacap technology.
The S&P 500 fell approximately 1.43% to close near 7,365 as the broad technology pullback weighed on the index. Chris Low at FHN Financial tied the move to fears that AI exuberance may be overdone, though several strategists framed the slide as a deleveraging episode rather than a break in underlying fundamentals.
WTI crude oil eased around 1.15% to settle near $73.2 per barrel. The decline appeared to track the continued reopening of the Strait of Hormuz, where tankers have grown more willing to broadcast their crossings as tensions cool, leaving prices well below their wartime peak.
Gold dropped roughly 1.96% to trade around $4,111 per ounce, an unusual move during a risk-off session. The weakness possibly reflected broad-based deleveraging alongside the stronger dollar, with investors raising cash rather than rotating into traditional havens.
Bitcoin fell approximately 2.43% to around $62,409, sliding with other risk assets as the equity selloff sapped appetite for speculative positions.
The U.S. 10-year Treasury yield edged lower to roughly 4.5% as Treasuries drew a safe-haven bid during the equity selloff, with the move sitting alongside firmer expectations for Fed rate increases later in the year.
Promoted: The Strategy is Half the Battle; Your Mindset is the Rest.
Most trading mistakes aren’t technical—they’re psychological. In the classic “Trading in the Zone” by Mark Douglas (⭐ 4.7★ | 10,000+ reviews on Amazon), you’ll learn how to master the probabilistic thinking and emotional discipline mentioned in today’s article. If you struggle with hesitation or breaking your rules, this is your manual for consistent execution.
Click on the link to learn more about “Trading in the Zone” by Mark Douglas!
Disclosure: To help support our content, we may earn a commission from our partners if you sign up through our links, at no extra cost to you.
FX Market Behavior: U.S. Dollar vs. Majors
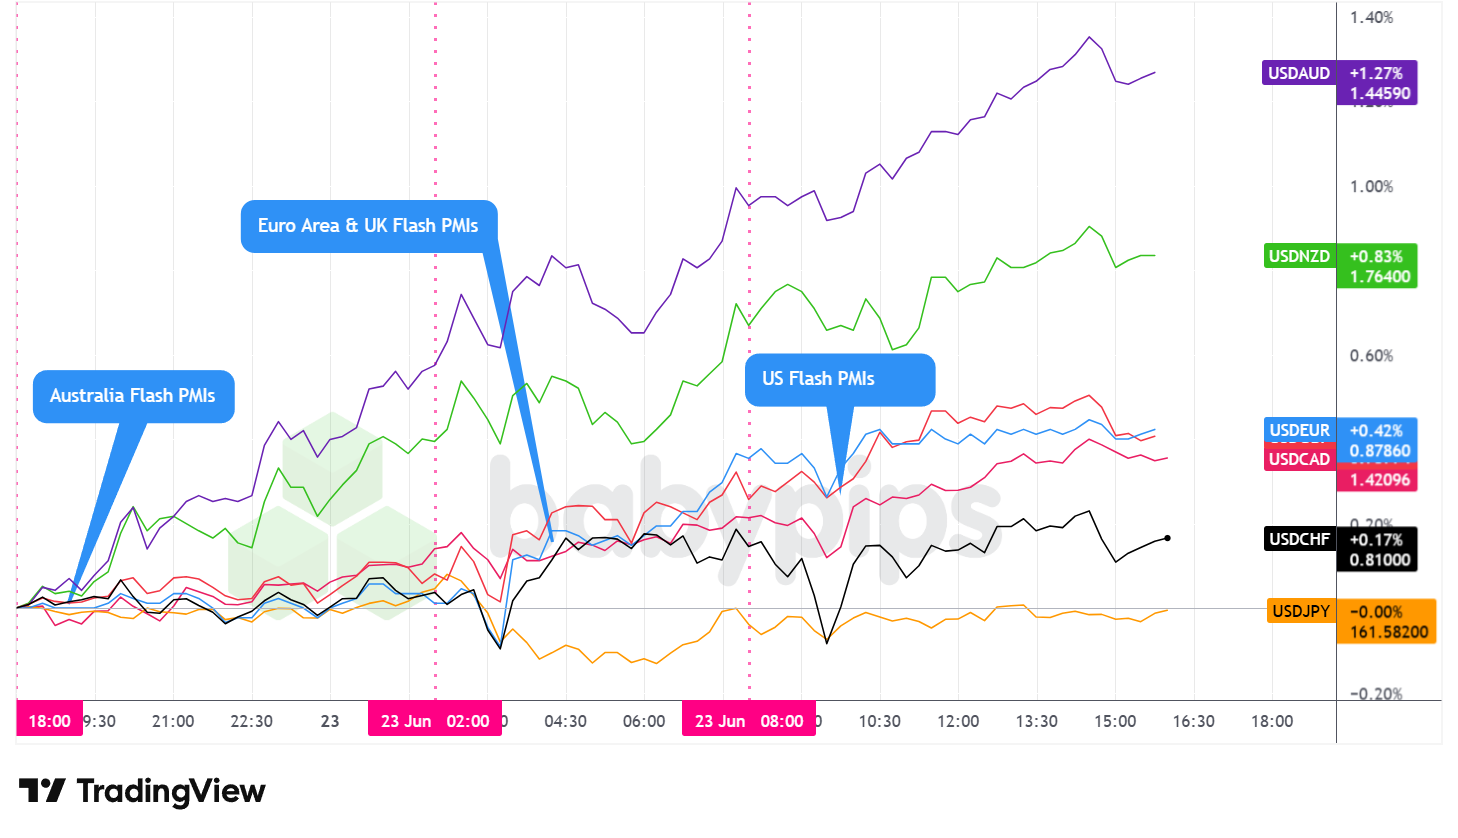
Overlay of USD vs. Majors – Chart Faster With TradingView
The U.S. dollar traded mixed but net higher against the major currencies through all three sub-sessions on Tuesday, finishing as the best-performing major and lifting the dollar index roughly 0.4% to around 101.4, its strongest level since November. The greenback’s largest gains came against the risk-sensitive Australian and New Zealand dollars.
During the Asian session, the dollar chopped in a narrow range with a slight upward lean. The dollar index dipped toward roughly 100.95 early before recovering, while regional risk currencies softened as equity markets across Asia came under heavy pressure. The yen held firmer than its peers, likely supported by haven demand and lingering intervention warnings out of Tokyo.
The London session brought a clearer bid for the dollar. A run of weak European flash PMIs, including a sharp miss in German services and softer UK services, reinforced the regional growth gap. The euro slid to its weakest level in a year as ECB President Christine Lagarde prompted traders to pare back bets on rate increases in the region, while the pound came under pressure as the data strengthened the case for a more cautious Bank of England. The dollar index pushed up toward the 101.33 area by the European close.
The U.S. session extended the dollar’s advance. A pair of forecast-beating U.S. flash PMIs, with manufacturing jumping to 55.7 and services firming to 51.3, underscored relative U.S. economic resilience and supported the move. The dollar index peaked near 101.43 before easing slightly into the close around 101.38. The Australian and New Zealand dollars took the brunt of the dollar’s strength amid the risk-off mood, while the yen finished roughly flat, a relative outperformer as haven flows and intervention risk cushioned it.
At Tuesday’s close, the dollar stood net higher across the board and ended as the strongest major currency, with the Fed’s hawkish lean contrasting sharply with the dovish signals coming from the ECB and the Bank of Japan.
Promoted: Keep Your Automated Edge Running 24/7.
Your algorithmic strategy shouldn’t rely on your home Wi-Fi. In high-volatility events, execution speed and uptime are what separate a winning backtest from a live market success. ForexVPS provides ultra-low latency, dedicated trading servers that keep your algos executing trades around the clock without interruption. Stop letting connectivity issues erode your edge.
Explore VPS plans at ForexVPS!
Disclosure: To help support our free daily content, we may earn a commission from our partners if you sign up through our links, at no extra cost to you.
Upcoming Potential Catalysts on the Economic Calendar
- U.S. API Crude Oil Stock Change for June 19, 2026 at 8:30 pm GMT
- BoJ Summary of Opinions at 11:50 pm GMT
- Australia CPI Growth Rate for May 2026 at 1:30 am GMT
- Australia RBA Hauser Speech at 6:30 am GMT
- Bank of Japan Himino Speech at 6:40 am GMT
- Swiss Economic Sentiment Index for June 2026 at 8:00 am GMT
- Germany Ifo Business Climate for June 2026 at 8:00 am GMT
- U.S. MBA 30-Year Mortgage Rate & Applications for June 19, 2026 at 11:00 am GMT
- Bank of Canada Rogers Speech at 11:15 am GMT
- Bank of England Breeden Speech at 11:15 am GMT
- Canada Manufacturing Sales Prel for May 2026 at 12:30 pm GMT
- U.S. Building Permits Final for May 2026 at 12:30 pm GMT
- Swiss SNB Quarterly Bulletin at 1:00 pm GMT
- U.S. New Home Sales for May 2026 at 2:00 pm GMT
- Bank of England Dhingra Speech at 3:00 pm GMT
- Bank of England Pill Speech at 4:30 pm GMT
- Canada BoC Summary of Deliberations at 5:30 pm GMT
- Bank of Japan Gov Ueda Speech at 8:00 pm GMT
- U.S. Fed Bank Stress Test Results at 8:00 pm GMT
Wednesday’s calendar leans heavily on central bank commentary and second-tier data. Australia’s May CPI early in the session could shape near-term RBA expectations, while Germany’s Ifo business climate offers another read on European momentum after the soft flash PMIs.
A cluster of Bank of England speakers, including Dhingra and Pill, may sharpen the rate-cut debate following the weak UK services print, and the Bank of Canada’s Summary of Deliberations could add color to Macklem’s stability remarks.
Late in the day, a speech from Bank of Japan Governor Ueda will draw scrutiny given the heightened intervention watch, and U.S. Fed bank stress test results round out the session.
Stay frosty out there, forex friends!
When equities tumble and currencies rally, many traders don’t realize what’s actually connecting those moves. Premium members can read our lesson:
📖 What Is Intermarket Analysis?
Reading this helps you understand how stock market volatility flows into currency prices, why safe-haven assets behave differently under different conditions, and how to read the broader asset class connections that drive your forex trades.
And if you’re not a Premium subscriber yet, consider joining.
With Babypips Premium, you get full access to School of Pipsology lessons that help you understand not just what your forex chart is showing, but how equities, bonds, commodities, and global sentiment shape the moves you’re trading.


