


Middle East geopolitics drove the opening trading day of the week as Iran and Israel exchanged missile salvos before a rapid de-escalation sequence, anchored by President Trump’s ceasefire calls and Iran’s decision to stand down its military operations, shifted the prevailing risk mood by the time the US session was underway. A recovery in chip and AI stocks helped equities claw back from early losses, while oil’s dramatic intraday round-trip move reflected the speed at which the geopolitical narrative can reshape commodity markets.
Check out the forex news and economic updates you may have missed in the latest trading session!
Forex News Headlines & Data:
- Iran and Yemen launched ballistic missiles toward Israel, prompting Israeli retaliatory strikes on approximately ten targets inside Iran; explosions were also reported near Riyadh’s Prince Sultan Air Base
- Japan GDP Price Index Final for March 31, 2026: 3.2% y/y (3.4% y/y forecast; 3.4% y/y previous)
- Japan GDP Growth Final for March 31, 2026: 1.8% y/y (2.1% y/y forecast; 1.3% y/y previous)
- Japan Current Account for April 2026: 3,907.0B (2,950.0B forecast; 4,682.0B previous)
- Japan Eco Watchers Survey Outlook for May 2026: 40.7 (40.0 forecast; 39.4 previous)
- Germany Factory Orders for April 2026: -3.8% m/m (-1.3% m/m forecast; 5.0% m/m previous)
- U.S. Consumer Inflation Expectations for May 2026: 3.5% (3.8% forecast; 3.6% previous)
- Iran’s armed forces subsequently announced an end to military operations against Israel after President Trump publicly called for both sides to stand down; Trump stated that an immediate ceasefire was being sought and described a deal as “very close”
Promotion: TradeZella is the top journaling app in the industry, and its new AI trading partner feature can break down and analyze your trades & build a game plan, freeing up time and energy to focus on the next moves!
Start Your Trading Journey with Tradezella & use code “PIPS20” for 20% off your first purchase!
Disclosure: To help support our free daily content, we may earn a commission from our partners if you sign up through our links, at no extra cost to you.
Broad Market Price Action:
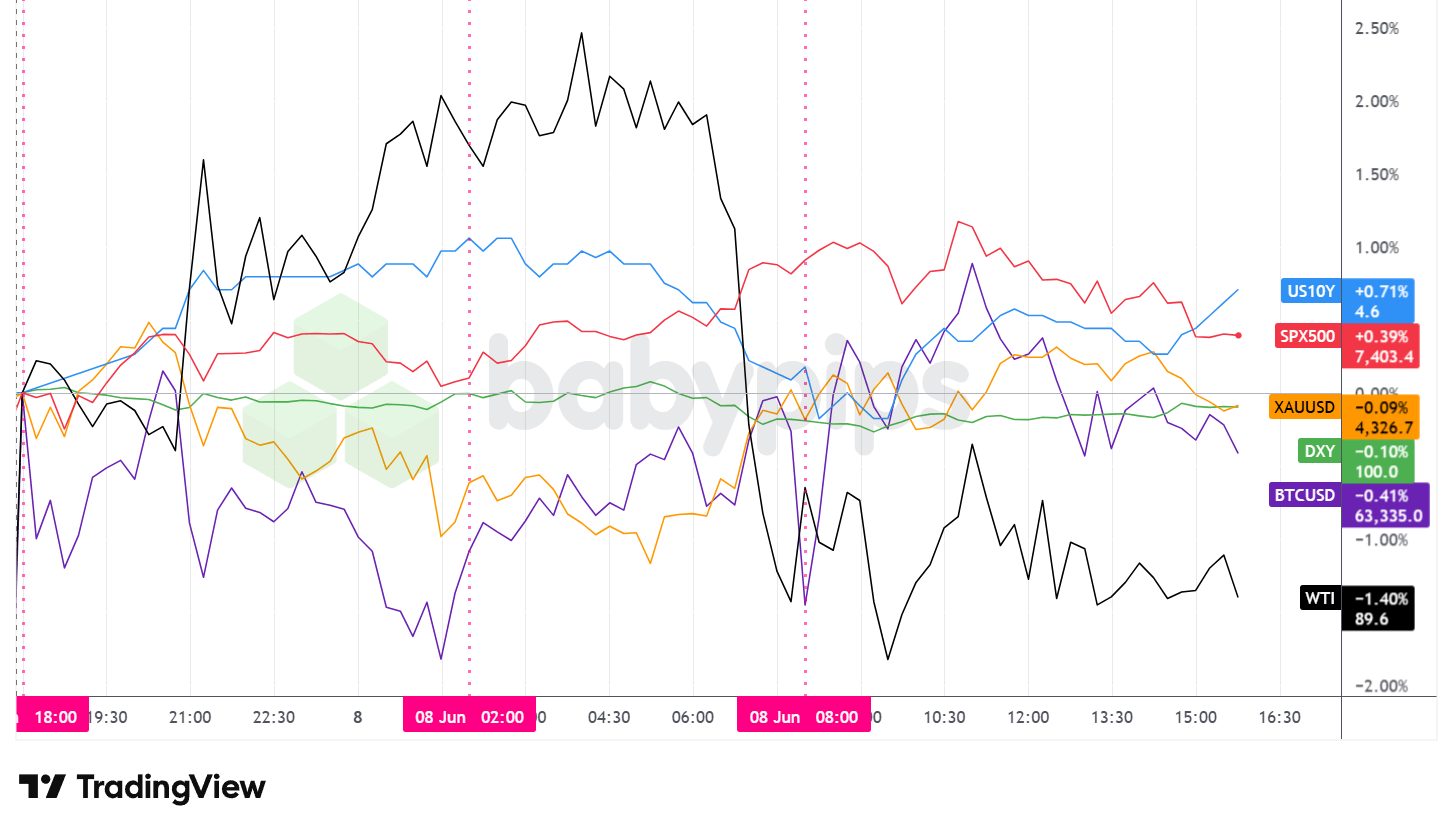
Dollar Index, Gold, Oil, S&P 500, U.S. 10-yr Yield, Bitcoin Overlay – Chart Faster With TradingView
Monday’s session was dominated by a dramatic round-trip in oil prices as the Iran-Israel conflict moved through multiple escalation and de-escalation phases within a single trading day. Volatility was most intense during the London session, where the pace of geopolitical headlines kept other asset classes in a holding pattern before a broad recovery took shape as ceasefire signals emerged.
WTI crude oil surged during the Asian session, trading above $93 per barrel at the intraday peak as Israeli airstrikes on Iranian facilities and retaliatory launches from Iran and Yemen stoked fears of a wider regional supply disruption. The rally reversed sharply around the London-to-US session transition as Iran declared an end to its military operations and Trump publicly called for an immediate ceasefire, with WTI closing approximately 1.4% lower near $89.60 per barrel and fully reversing the day’s earlier gains.
The S&P 500 recovered from early weakness to settle up approximately 0.4% near 7,400. Equity index futures had opened the session near Friday’s depressed levels, but the index gradually recovered as ceasefire optimism built through the London session, with oil’s pullback further supporting the improved sentiment. A sharp rebound in chip stocks, including Nvidia and Micron, provided the primary lift for the index.
Gold had a turbulent session, sliding to fresh June lows during the London morning before recovering to close roughly flat near $4,327, down less than 0.1% on the day. The precious metal’s inability to sustain any meaningful intraday recovery appeared to reflect the hawkish backdrop established by Friday’s blowout payrolls report, which led Goldman Sachs to pull its December rate cut forecast. Gold’s subdued afternoon range may suggest that traders were in a cautious, wait-and-see posture ahead of Wednesday’s May CPI report, which is expected to show a year-over-year advance of approximately 4.2%, potentially the highest reading in more than three years.
U.S. 10-year Treasury yields edged modestly higher on the day to approximately 4.57%, likely extending the post-NFP repricing of Federal Reserve rate expectations. Yields dipped briefly around the London-to-US session crossover, possibly correlating with the ceasefire-driven risk-on impulse, before recovering and stabilizing through the US afternoon.
Bitcoin closed near $63,300, with the cryptocurrency largely tracking broader risk sentiment without generating any asset-specific catalyst of its own. Bitcoin briefly tested the $64,200 area during the early US session before pulling back as enthusiasm faded through the afternoon.
Promoted: Is Your Small Account Holding Your Strategy Back?
Trading $100 isn’t the same as trading $100k. Emotional discipline & trading flexibility is easier when you have the right backing. FTMO is a global prop firm with a 4.8★ rating on 40K+ reviews, serving traders since 2015! No time limits. Free trials. Up to $200K in Demo Capital.
Start a free trial with FTMO!
Disclosure: To help support our content, we may earn a commission from our partners if you sign up through our links, at no extra cost to you.
FX Market Behavior: U.S. Dollar vs. Majors
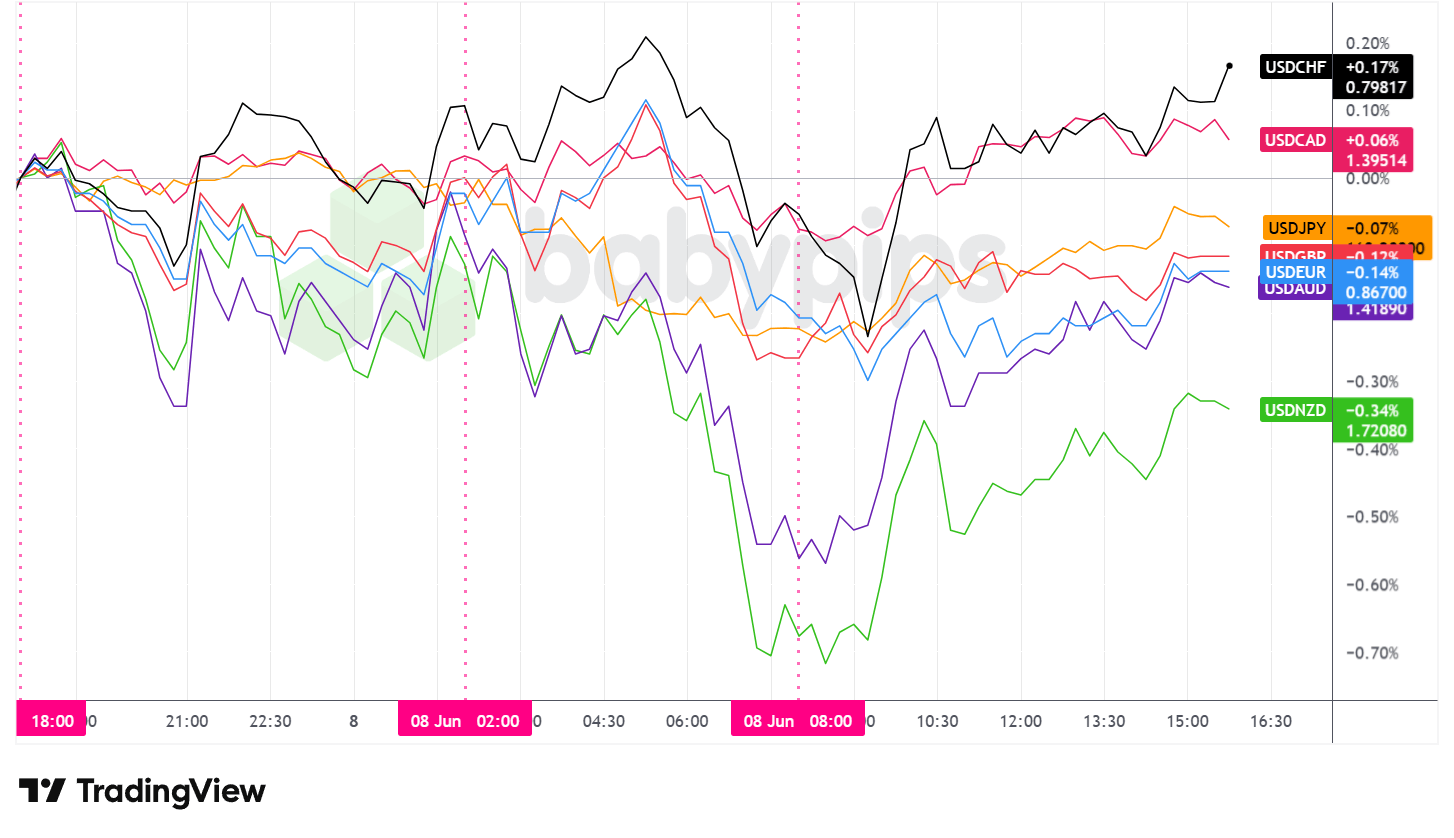
Overlay of USD vs. Majors – Chart Faster With TradingView
The U.S. dollar traded in a choppy, mixed fashion on Monday and ended the session with an arguably net bearish lean against the major currencies, as geopolitical de-escalation appeared to be the dominant driver, redirecting flows toward risk-sensitive currencies and away from the greenback.
During the Asian session, the dollar traded mostly sideways with a modest net bearish bias. Price action was choppy and no major regional catalysts drove a clear directional move. Japan’s final Q1 GDP revision confirmed quarterly growth of 0.5% and posted an annualized reading of 1.8%, above the prior 1.3% figure, though the dollar’s response against the yen was limited and USDJPY oscillated near flat throughout.
The London session was the day’s most volatile stretch in FX markets. The dollar initially traded mixed but shifted to noticeably broader bearish pressure mid-morning heading into the US open. On the FX overlay chart, this manifested as a synchronized decline in most USD pairs, most sharply in USDNZD, roughly coinciding with Iran’s announcement that it was standing down its military operations and Trump’s repeated calls for a ceasefire. The improved risk tone appeared to pull demand toward commodity-linked and growth-sensitive currencies at the expense of the greenback. Germany’s sharply disappointing April factory orders release of -3.8% month-over-month, well below the -1.3% consensus, did not appear to generate notable dollar demand against the euro during this period, suggesting the geopolitical headline was the dominant force.
Following the US session open, the dollar staged a gradual partial recovery against most majors, paring some of the London session losses as the initial ceasefire euphoria moderated. The May Consumer Inflation Expectations reading of 3.5%, which came in below both the 3.8% forecast and the prior 3.6% reading, may have capped the dollar’s recovery potential, offering a mild dovish counterweight to the Goldman Sachs rate cut call withdrawal. The greenback then traded choppy and broadly sideways through the remainder of the afternoon.
Promoted: The Strategy is Half the Battle; Your Mindset is the Rest.
Today’s daily recap highlights a market driven geopolitical developments and shifts in Fed policy expectations. But as any pro will tell you, understanding market drivers can aren’t enough if the trader lacks the discipline to execute a solid plan on it.
In “Unknown Market Wizards,” (⭐ 4.6★ | 1,400+ reviews on Amazon) Jack Schwager interviews successful traders to reveal a common truth: their edge isn’t just knowledge or skills—it’s their psychological resilience and rigid risk control. Whether you’re navigating shifting geopolitical themes or top tier economic data, learn how the “wizards” stay clinical and execute when the rest of the market is emotional.
Master Your Trading Mindset with Market Wizards!
Disclosure: We may earn a commission from our partners if you sign up through our links, at no extra cost to you.
Upcoming Potential Catalysts on the Economic Calendar
- New Zealand Manufacturing Sales for March 31, 2026 at 10:45 pm GMT
- U.K. BRC Retail Sales Monitor for May 2026 at 11:01 pm GMT
- Australia Westpac Consumer Confidence Change for June 2026 at 12:30 am GMT
- Australia NAB Business Confidence for May 2026 at 1:30 am GMT
- China Balance of Trade for May 2026 at 3:00 am GMT
- Germany Balance of Trade for April 2026 at 6:00 am GMT
- U.S. NFIB Business Optimism Index for May 2026 at 10:00 am GMT
- U.S. ADP Employment Change Weekly for May 23, 2026 at 12:15 pm GMT
- Canada Balance of Trade for April 2026 at 12:30 pm GMT
- U.S. Balance of Trade for April 2026 at 12:30 pm GMT
- U.S. Existing Home Sales for May 2026 at 2:00 pm GMT
- U.S. Wholesale Inventories for April 2026 at 2:00 pm GMT
- ECB President Lagarde Speech at 4:30 pm GMT
Tuesday’s calendar is headlined by ECB President Lagarde’s speech at 4:30 pm GMT, which euro traders will be watching for signals on the eurozone’s monetary policy trajectory given continued weakness in German industrial data and the uncertain geopolitical backdrop.
China’s May trade balance at 3:00 am GMT may set early tone for commodity and risk-sensitive currency markets.
The afternoon batch of US and Canadian trade data and the ADP employment figure may offer positioning clues ahead of Wednesday’s May CPI report, broadly considered the next major test for Federal Reserve rate expectations following Friday’s payrolls beat.
Stay frosty out there, forex friends!


