


Monday’s session was defined by geopolitical whiplash as a rapid sequence of conflicting US-Iran headlines drove sharp reversals across oil, equities, and bond markets throughout the day. Expectations for a diplomatic breakthrough were repeatedly raised and dashed: Iran rejected US demands as unacceptable, a drone struck near a UAE nuclear facility, and reports emerged that President Trump had planned renewed military strikes on Iran for Tuesday.
By the late US afternoon, Trump confirmed on social media he had called off the attack after the leaders of Saudi Arabia, Qatar, and the UAE requested more time for negotiations, helping oil ease off intraday highs and equities trim their losses — though multi-year high bond yields and persistent energy supply uncertainty left the broader risk backdrop fragile into the close.
Check out the forex news and economic updates you may have missed in the latest trading session!
Forex News Headlines & Data:
- New Zealand Services NZ PSI for April 2026: 48.9 (45.0 forecast; 46.0 previous)
-
China’s April economic data came in broadly below expectations, adding a second headwind to the day’s already fragile risk environment.
- China House Price Index for April 2026: -3.5% y/y (-3.5% y/y forecast; -3.4% y/y previous)
- China Unemployment Rate for April 30, 2026: 5.2% (5.5% forecast; 5.4% previous)
- China Industrial Production for April 2026: 4.1% y/y (5.5% y/y forecast; 5.7% y/y previous)
- China Retail Sales for April 2026: 0.2% (2.2% forecast; 1.7% previous)
- China Fixed Asset Investment (YTD) for April 2026: -1.6% y/y (1.5% y/y forecast; 1.7% y/y previous)
- Swiss GDP Growth Rate Flash for March 31, 2026: 0.5% q/q (0.3% q/q forecast; 0.2% q/q previous)
- U.S. NY Fed Services Activity Index for May 2026: -5.8 (-14.0 previous)
- U.S. NAHB Housing Market Index for May 2026: 37.0 (35.0 forecast; 34.0 previous)
- The US Treasury Department issued a new 30-day general license allowing the sale of Russian crude oil and petroleum products currently loaded on tankers, days after the previous waiver lapsed.
- US President Donald Trump said he was “not open” to concessions after Iran’s latest response on peace talks; says he will hold off on Iran attacks at request of Gulf states
Promoted: Day traders & Scalpers have better odds of making great decisions if they see market catalysts right away. Get the real-time feed that pros use to catch the news.
Join FinancialJuice for Free to learn more!
Disclosure: We may earn a commission from our partners if you sign up through our links, at no extra cost to you.
Broad Market Price Action:
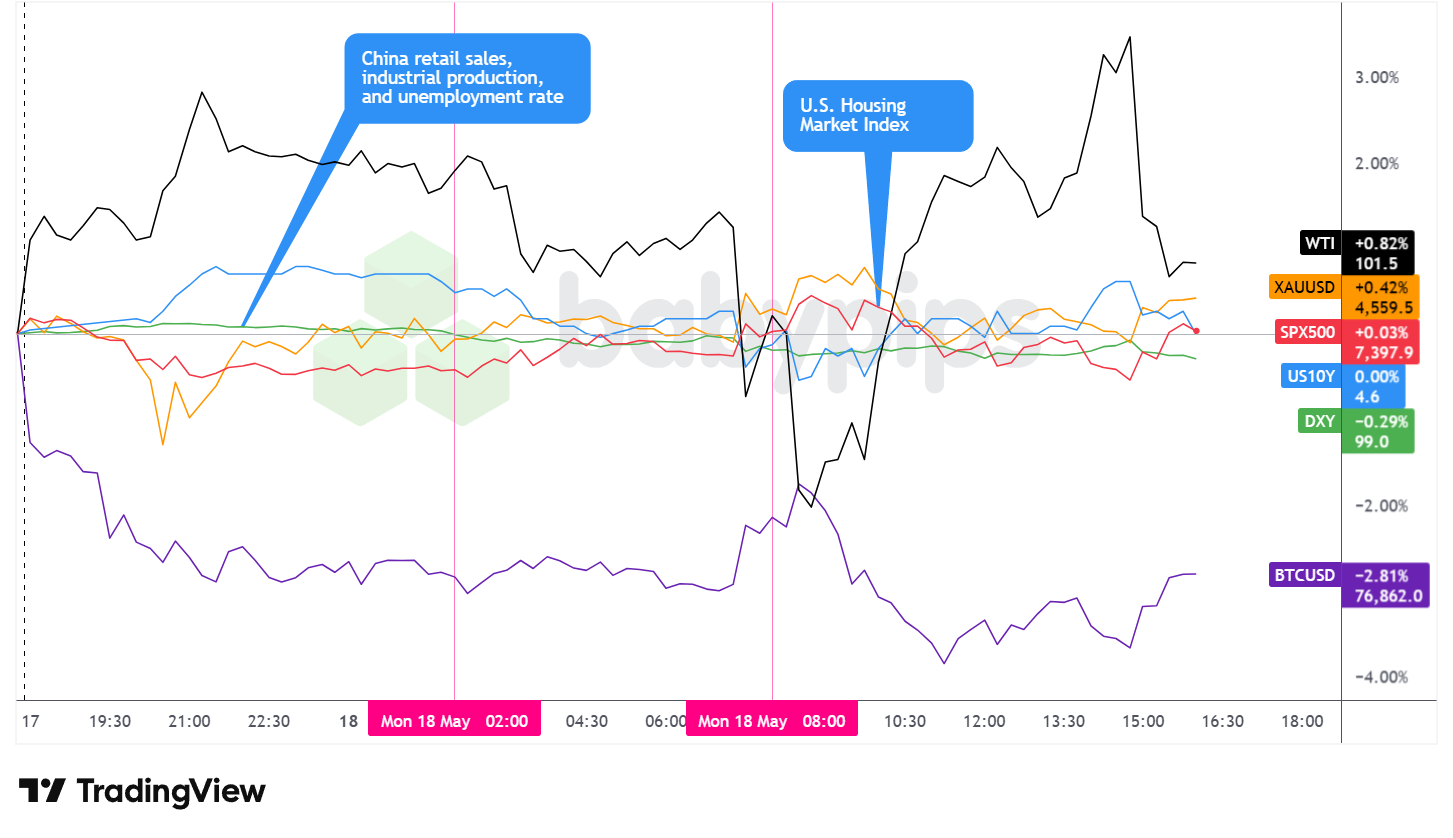
Dollar Index, Gold, Oil, S&P 500, U.S. 10-yr Yield, Bitcoin Overlay – Chart Faster With TradingView
Monday’s broad market landscape was shaped almost entirely by the evolving US-Iran diplomatic narrative, with assets whipsawing as headlines alternated between escalation and relief throughout the session.
WTI crude oil posted the strongest performance among tracked assets, gaining approximately 0.82% to trade near $101.50 per barrel. The intraday range, however, was considerably wider — prices surged to the $104 area during the US session on concerns about renewed military action before reversing sharply after Trump announced the cancellation of Tuesday’s planned strike. The back-and-forth price action closely tracked the news flow, with oil prices remaining elevated relative to the prior session even after the late-day pullback, possibly reflecting the continued closure of the Strait of Hormuz and the absence of a credible resolution to the conflict.
Gold advanced approximately 0.42% to trade near $4,559.50, likely holding its role as a partial safe-haven hedge even as the session’s risk mood oscillated in both directions. The precious metal’s intraday volatility was relatively contained compared with oil, bitcoin and equities, with prices finding broad support throughout the day.
The S&P 500 closed roughly flat, up approximately 0.03% near 7,397.9, masking a turbulent session that saw the index drop sharply on negative Iran headlines before recovering most of its losses following Trump’s strike cancellation. The index briefly pushed toward the 7,430 area during the recovery before fading into the close, suggesting that while the diplomatic news provided short-term relief, lingering concerns about elevated energy costs and multi-year high bond yields continued to limit upside participation.
The US 10-year Treasury yield closed just under 4.60%, roughly unchanged on the day, though the intraday journey was far from quiet. Yields climbed to approximately 4.63% during the Asian session before partially retracing as diplomatic speculation briefly improved sentiment, then stabilized near opening levels through the US afternoon. The muted net daily change belied a volatile session in which yields served as a barometer for shifting war-risk and inflation expectations throughout the day.
Bitcoin was the session’s weakest performer among tracked assets, declining approximately 2.81% to trade near $76,862. The cryptocurrency had weakened from the Asia session open, briefly finding support near the $76,000 area before consolidating in a subdued range through the US session. The decline extended a pullback that began last week as risk sentiment deteriorated across asset classes amid the escalating Iran conflict.
Promotion: If your confidence has grown in your market awareness & strategies with this market recap, and you wanna take action, Maven Trading can help. They provide simulated funding challenges starting as low as $15, allowing you to trade major pairs with professional-sized capital. No time limits mean you can take swing plays on these market themes without the pressure of a ticking clock.
Learn More About Maven Trading Today!
Disclosure: We may earn a commission from our partners if you sign up through our links, at no extra cost to you.
FX Market Behavior: U.S. Dollar vs. Majors
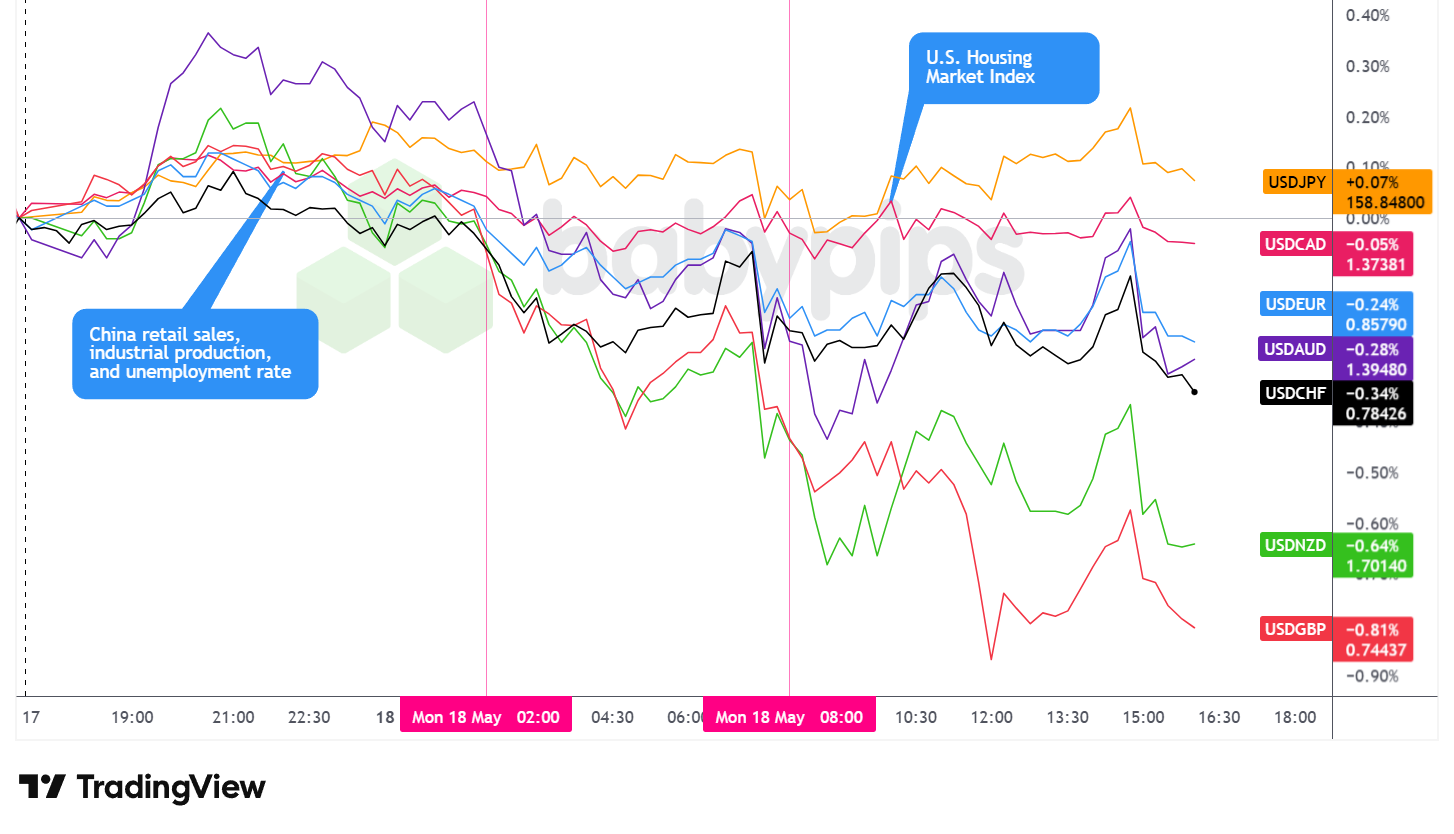
Overlay of USD vs. Majors – Chart Faster With TradingView
The US dollar ended Monday as one of the weakest performers among the major currencies, posting declines against all peers except the Japanese yen.
During the Asian session, the dollar opened with a modest rebound, possibly reflecting early-session caution as markets digested the latest developments in Iran ceasefire negotiations and the news of a drone strike near the UAE nuclear facility. That initial recovery proved short-lived. From around the middle of the Asian morning, the dollar turned broadly lower against the major currencies as China’s disappointing April data landed — retail sales badly missing at 0.2% against a 2.2% forecast, industrial production coming in well below expectations at 4.1%, and fixed-asset investment contracting year-to-date. The greenback’s weakness through this period extended across most pairs, and the overlay chart above shows the move coinciding with the China data, consistent with a broad shift in market sentiment as the data crossed.
The London session extended the dollar’s decline into the European morning, with broad USD softness persisting through approximately mid-session as no major UK or eurozone data releases provided a countervailing catalyst. The dollar’s decline eased toward the middle of the London morning before the greenback began to stabilize and recover.
Heading into the US session, the dollar staged a partial rebound across the board, possibly reflecting pre-session positioning or a modest improvement in sentiment as Trump’s public commentary began to shape expectations around the Iran situation. However, the recovery was brief: the dollar turned lower again just ahead of the US session open, with the overlay chart showing a renewed leg down across several pairs in the minutes before the NY open. Once US trading was underway, the dollar stabilized and traded sideways and choppy through the close, with the NAHB Housing Market Index beat at 10:00 ET (annotated on the chart) briefly correlating with a mild USD bounce that settled into sideways action, likely reactions to geopolitical news flow.
Promotion: When the Market Swings, Are You Reacting or Executing?
In “Positive Trading Psychology,” renowned psychologist Brett Steenbarger reveals in his newest book that the secret to navigating volatility isn’t “fixing” your flaws—it’s doubling down on your innate character strengths. Learn how to stay clinical while the rest of the market is emotional, turning sudden market shaking news into your professional edge.
Learn more about “Positive Trading Psychology: Turning personal strengths into trading strengths” on Amazon!
Disclosure: We may earn a commission from our partners if you sign up through our links, at no extra cost to you.
Upcoming Potential Catalysts on the Economic Calendar
- New Zealand Business NZ PMI for April 2026 at 10:30 pm GMT
- New Zealand Food Price Index for April 2026 at 10:45 pm GMT
- U.S. Fed Barr Speech at 11:00 pm GMT
- Japan PPI for April 2026 at 11:50 pm GMT
- China President Trump and President Xi Summit
- Australia Consumer Inflation Expectations for May 2026
- Japan Machine Tool Orders for April 2026 at 6:00 am GMT
- Swiss Industrial Production for March 31, 2026 at 6:30 am GMT
- China Current Account Prel for March 31, 2026 at 9:00 am GMT
- U.K. NIESR Monthly GDP Tracker for April 2026
- Canada Housing Starts for April 2026 at 12:15 pm GMT
- Canada Manufacturing Sales Final for March 2026 at 12:30 pm GMT
- U.S. NY Empire State Manufacturing Index for May 2026 at 12:30 pm GMT
- U.S. Industrial & Manufacturing Production for April 2026 at 1:15 pm GMT
- U.S. Capacity Utilization Rate for April 2026 at 1:15 pm GMT
Tuesday’s calendar opens overnight with Japan’s preliminary Q1 2026 GDP print and GDP Price Index at 11:50 pm GMT, offering the first look at whether the Japanese economy contracted under the weight of surging energy import costs. Australian markets will be watching the RBA Meeting Minutes at 1:30 am GMT, along with a speech from RBA’s Hunter at 12:30 am GMT and the Westpac Consumer Confidence reading, for any guidance on the RBA’s rate path in the current high-energy-cost environment.
During the European morning, the UK employment update arrives at 6:00 am GMT, covering Claimant Count Change for April and the Unemployment Rate for March, with the potential to influence Bank of England rate expectations. BoE Deputy Governor Breeden speaks at 9:10 am GMT, and ECB Chief Economist Lane follows at noon GMT.
The North American session brings Canada’s April CPI at 12:30 pm GMT alongside Building Permits and the New Housing Price Index — Canada’s inflation print will be watched closely given the global energy price backdrop. Fed Governor Waller speaks at 1:00 pm GMT, and US Pending Home Sales for April are due at 2:00 pm GMT. Waller’s remarks in particular may be closely monitored for clues about how the Fed is thinking about the rate path as oil prices keep inflation risks elevated.
Stay frosty out there, forex friends!
Monday’s session was completely driven by geopolitical whiplash as US-Iran tensions alternated between escalation and de-escalation throughout the day. Most traders don’t understand how events like these move currencies beyond the obvious safe-haven flow. Premium members can read our lesson:
📖 Geopolitical Risk, Trade Policy, and Safe Haven Flows
Reading this helps you understand which currencies benefit when global risk sentiment deteriorates, how geopolitical shocks transmit through asset prices, and which safe havens to monitor when the world starts breaking things.
And if you’re not a Premium subscriber yet, now’s a good time to sign up.
With Babypips Premium, you get full access to School of Pipsology lessons that help you understand how to position for geopolitical risk, recognize the warning signs before moves hit, and profit from the safe-haven flows that dominate session after session.


