


Artificial intelligence enthusiasm, a landmark Trump-Xi summit in Beijing, and stronger-than-expected U.S. retail sales combined to push the S&P 500 above 7,500 for the first time, while the U.S. dollar advanced progressively through the day to close as the top-performing major currency. Gold declined as risk appetite improved, and Bitcoin surged past $80,000, correlating with a significant regulatory advance in Washington on digital asset legislation.
Check out the forex news and economic updates you may have missed in the latest trading session!
Forex News Headlines & Data:
- New Zealand Visitor Arrivals for March 2026: 15.1% y/y (17.0% y/y forecast; 15.2% y/y previous)
- U.K. RICS House Price Balance for April 2026: -34.0% (-24.0% forecast; -23.0% previous)
-
U.K. GDP Growth Rate Prel for Q1 2026: 1.1% y/y (1.0% y/y forecast; 1.0% y/y previous); 0.6% q/q (0.5% q/q forecast; 0.1% q/q previous)
- U.K. Manufacturing Production for March 2026: 1.2% y/y (-0.1% y/y forecast; -0.5% y/y previous)
- U.K. Industrial Production for March 2026: 0.0% y/y (0.0% y/y forecast; -0.4% y/y previous)
- U.K. Balance of Trade for March 2026: -9.66B (-3.4B forecast; -0.72B previous)
- China Outstanding Loan Growth for April 2026: 5.6% y/y (5.5% y/y forecast; 5.7% y/y previous)
- China New Loans for April 2026: -10.0B (320.0B forecast; 2,990.0B previous)
- Canada New Motor Vehicle Sales for March 2026: 176.5k (119.0k forecast; 124.0k previous)
- Canada Wholesale Sales Final for March 2026: 1.9% m/m (1.3% m/m forecast; 2.0% m/m previous)
- U.S. Initial Jobless Claims for May 9, 2026: 211.0k (209.0k forecast; 200.0k previous)
- U.S. Export Prices for April 2026: 8.8% y/y (6.6% y/y forecast; 5.6% y/y previous)
- U.S. Import Prices for April 2026: 4.2% y/y (2.9% y/y forecast; 2.1% y/y previous)
- U.S. Retail Sales for April 2026: 4.9% y/y (3.3% y/y forecast; 4.0% y/y previous)
- The Republican-led Senate Banking Committee held a markup hearing on Thursday and advanced the long-stalled Digital Asset Market Clarity Act (CLARITY Act) in a 15-9 bipartisan vote.
Promoted: Day traders & Scalpers have better odds of making great decisions if they see market catalysts right away. Get the real-time feed that pros use to catch the news.
Join FinancialJuice for Free to learn more!
Disclosure: We may earn a commission from our partners if you sign up through our links, at no extra cost to you.
Broad Market Price Action:
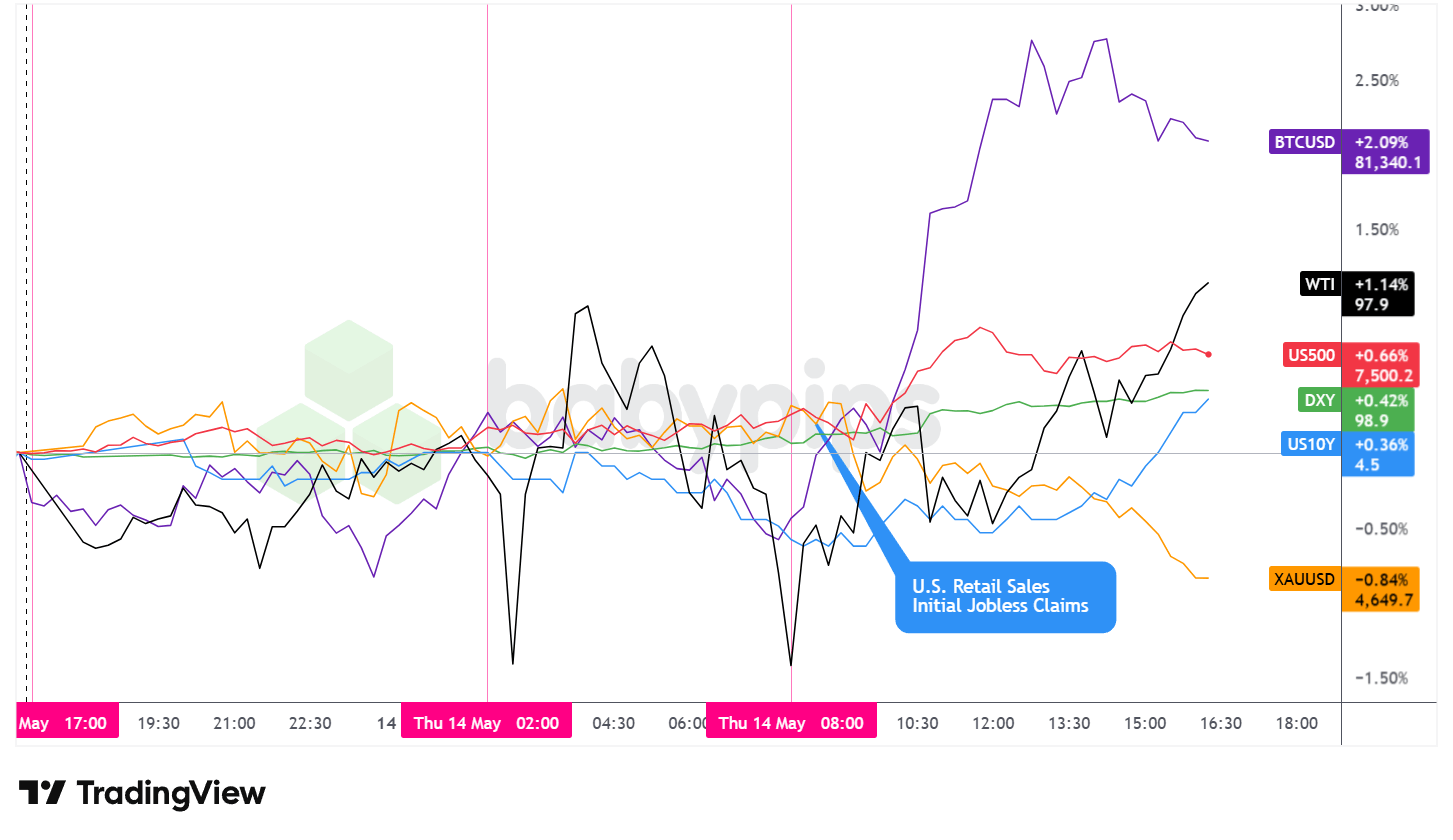
Dollar Index, Gold, Oil, S&P 500, U.S. 10-yr Yield, Bitcoin Overlay – Chart Faster With TradingView
Thursday’s session carried a clear risk-on tone throughout, driven by AI-related equity momentum, relative stability from the Trump-Xi diplomatic backdrop, and a U.S. data slate that signaled continued consumer resilience despite elevated energy costs.
The S&P 500 was the headline performer among traditional risk assets, climbing approximately 0.66% to close near 7,500, crossing that level for the first time. The index traded in a relatively tight range through the Asian and London hours, before accelerating sharply at 8:30 AM ET alongside the release of U.S. April retail sales and weekly jobless claims. The index pushed to an intraday high near 7,516 before fading slightly and consolidating through the afternoon. The broad thrust of the advance likely reflected a combination of the above-forecast retail data and sustained momentum in AI-related technology names, including a sharp rally in Cisco following its restructuring announcement.
WTI crude oil posted a net gain of approximately 1.14% to close near $97.90, though the session was marked by sharp intraday swings. Oil dropped steeply near the London open, recovered toward the $98 area, then dipped again around the U.S. session open before gradually firming through the afternoon. The volatility likely reflected ongoing uncertainty around Hormuz supply dynamics and OPEC’s reduced demand outlook, partially offset by Trump’s comments suggesting China could support efforts toward a diplomatic resolution to the Iran conflict.
Bitcoin was the strongest performer among tracked assets, advancing approximately 2.09% to close near $81,340. The cryptocurrency moved mostly sideways through the Asian session with a pullback into the upper $79,000 area ahead of the U.S. open, before surging sharply through the early U.S. session to an intraday high near $82,054. The move may have partly reflected positive sentiment following the Senate Banking Committee’s advancement of the CLARITY Act, a significant milestone for U.S. digital asset legislation, though intraday timing of the legislative development relative to the price move is worth verifying before attributing causality with confidence.
Gold was the session’s clear underperformer, declining approximately 0.84% to close near $4,650. The metal was active and elevated during the Asian and early London sessions, trading near the $4,710 area, before a sustained sell-off took hold through the U.S. afternoon. The weakness may have reflected a rotation away from safe-haven assets as equity momentum built, alongside the headwind from a stronger dollar and modestly higher Treasury yields.
The U.S. 10-year Treasury yield edged up to approximately 4.50% on the day, with most of the movement occurring during the U.S. session. The gradual drift higher in yields likely correlated with the above-forecast retail sales print, as well as the notably strong April import and export price data, both of which printed well above expectations and may have added to concerns about the persistence of energy-driven inflation.
Promotion: If your confidence has grown in your market awareness & strategies with this market recap, and you wanna take action, Maven Trading can help. They provide simulated funding challenges starting as low as $15, allowing you to trade major pairs with professional-sized capital. No time limits mean you can take swing plays on these market themes without the pressure of a ticking clock.
Learn More About Maven Trading Today!
Disclosure: We may earn a commission from our partners if you sign up through our links, at no extra cost to you.
FX Market Behavior: U.S. Dollar vs. Majors
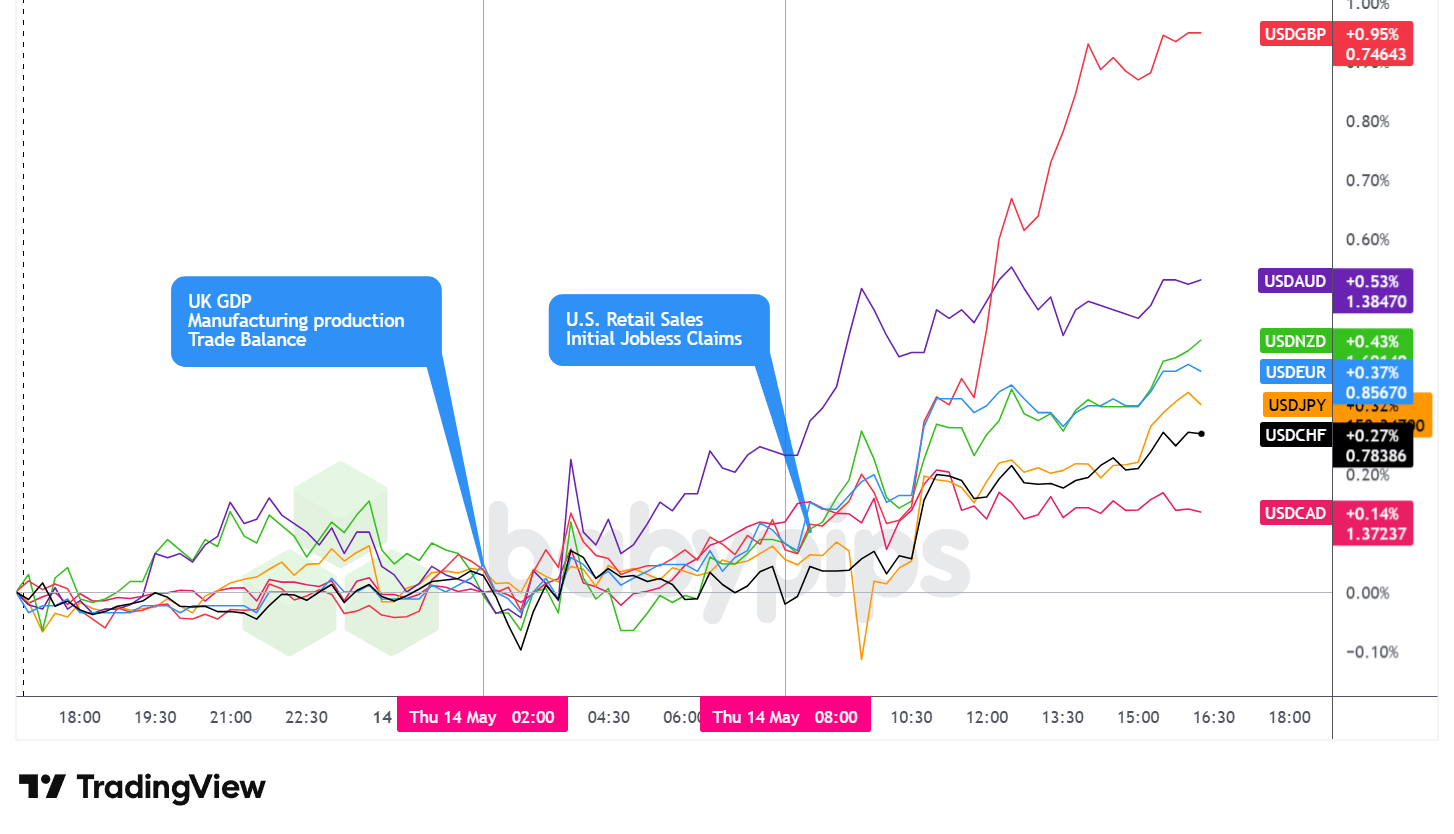
Overlay of USD vs. Majors – Chart Faster With TradingView
The U.S. dollar advanced steadily through Thursday’s session, ultimately closing as the best-performing major currency with broad-based gains across all tracked pairs.
During the Asian session, the dollar saw low volatility and traded mostly sideways against the major currencies, carrying arguably a slight net bullish lean. There were no significant regional data releases driving directional conviction. Market attention was broadly focused on the Trump-Xi summit in Beijing, where a constructive tone from both leaders provided a steady geopolitical backdrop. The PBOC’s strong yuan fixing attracted attention, but the dollar’s behavior against other major currencies remained contained.
The London session opened with a brief dip in the dollar before it rebounded against the majors. UK Q1 GDP came in ahead of forecast at 0.6% q/q, and manufacturing production for March significantly beat expectations. However, the UK’s trade balance widened sharply to -9.66B against a -3.4B forecast, business investment disappointed against a positive consensus, the RICS house price balance fell to -34% against a -24% forecast, and construction orders posted a deep annual contraction. The mixed UK data appeared to limit any meaningful sterling rally on the GDP headline, while the pound also faced domestic political pressure as Andy Burnham’s announced challenge to Prime Minister Starmer added to sterling selling. The dollar stabilized following the initial London dip and began creeping higher as the session wore on.
During the U.S. session, the dollar continued its gradual advance. The 8:30 AM ET data block brought April retail sales above forecast on both the headline (0.5% m/m versus 0.4% expected) and the ex-autos measure (0.7% m/m versus 0.3% expected), alongside meaningfully stronger-than-expected April import and export prices. Weekly jobless claims came in at 211k, a slight miss relative to the 209k forecast but consistent with a healthy labor market. The data combination appeared to reinforce the case for U.S. economic resilience, and the dollar continued to grind higher through the afternoon.
Promotion: When the Market Swings, Are You Reacting or Executing?
In “Positive Trading Psychology,” renowned psychologist Brett Steenbarger reveals in his newest book that the secret to navigating volatility isn’t “fixing” your flaws—it’s doubling down on your innate character strengths. Learn how to stay clinical while the rest of the market is emotional, turning sudden market shaking news into your professional edge.
Learn more about “Positive Trading Psychology: Turning personal strengths into trading strengths” on Amazon!
Disclosure: We may earn a commission from our partners if you sign up through our links, at no extra cost to you.
Upcoming Potential Catalysts on the Economic Calendar
- New Zealand Business NZ PMI for April 2026 at 10:30 pm GMT
- New Zealand Food Price Index for April 2026 at 10:45 pm GMT
- U.S. Fed Barr Speech at 11:00 pm GMT
- Japan PPI for April 2026 at 11:50 pm GMT
- China President Trump and President Xi Summit
- Australia Consumer Inflation Expectations for May 2026
- Japan Machine Tool Orders for April 2026 at 6:00 am GMT
- Swiss Industrial Production for March 31, 2026 at 6:30 am GMT
- China Current Account Prel for March 31, 2026 at 9:00 am GMT
- U.K. NIESR Monthly GDP Tracker for April 2026
- Canada Housing Starts for April 2026 at 12:15 pm GMT
- Canada Manufacturing Sales Final for March 2026 at 12:30 pm GMT
- U.S. NY Empire State Manufacturing Index for May 2026 at 12:30 pm GMT
- U.S. Industrial & Manufacturing Production for April 2026 at 1:15 pm GMT
- U.S. Capacity Utilization Rate for April 2026 at 1:15 pm GMT
Friday’s economic calendar is lighter than Thursday’s dense slate, though a few items warrant close attention. Fed Governor Barr’s speech late Thursday evening may draw scrutiny given the day’s notably above-forecast import and export price data, which could prompt questions about how the Fed is weighing energy-driven inflation pressures against broader economic resilience signals.
Japan’s April PPI will be watched in the context of the yen’s continued depreciation and the BOJ’s sensitivity to import-driven inflation. The continuation of the Trump-Xi summit remains the dominant macro backdrop, with any fresh statements on trade deals, Taiwan, or the Iran conflict likely to drive intraday moves in the yuan and broader risk assets.
On the U.S. side, Friday’s industrial production and capacity utilization data will offer additional insight into the manufacturing sector’s health following Thursday’s strong business inventories reading.
Stay frosty out there, forex friends!
Thursday’s market session was a textbook risk-on environment: equities rallied, gold sold off, Bitcoin surged, and the dollar strengthened across the board. But most traders don’t understand the mechanism that ties all these moves together. Premium members can read our lesson:
📖 Risk-On / Risk-Off: How Global Mood Moves Currencies
Reading this helps you understand why equities, commodities, and currencies move in coordinated patterns, how to spot a risk-on or risk-off shift before it happens, and which currency pairs win or lose when global appetite for risk changes.
And if you’re not a Premium subscriber yet, consider joining to gain this kind of clarity.
With Babypips Premium, you get full access to School of Pipsology lessons that help you understand the hidden forces connecting your FX pairs to equities, gold, and crypto, so you can anticipate multi-market moves instead of just reacting to them


