


With a quiet calendar both behind and ahead of us, we’re checking out the momentum in NZD/CHF for a potential short-term setup.
Before moving on, ICYMI, today’s Daily London Session Watchlist looked at an opportunity forming on USD/JPY after breaking a key resistance area, so be sure to check that out to see if there is still a potential play!
Intermarket Snapshot
| Equity Markets | Bond Yields | Commodities & Crypto |
| DAX: 13436.64 -0.35% FTSE: 7594.20 +0.08% S&P 500: 3274.37 +0.28% DJIA: 28851.03 +0.09% |
US 10-yr 1.85% +0.024 Bund 10-YR -0.162% +0.035 UK 10-YR: 0.744% -0.027 JPN 10-YR: -0.001% +0.004 |
Oil: 61.86 -1.34% Gold: 1573.60 -0.04% Bitcoin: 8065.75 -0.94% Etherium: 142.79 -1.61% |
Fresh Market Headlines & Economic Data:
- Bank for International Settlements sees first expansion since 2011
- U.S. Small Business Optimism Dips in December; Remains Historically Strong in 2019
- US consumer prices increase moderately in December
- Stabilizing euro zone growth vindicates ECB: Mersch
- Switzerland rejects U.S. allegations of currency manipulation
- Swiss National Bank under rising pressure after five years of negative rates
Upcoming Potential Catalysts on the Forex Calendar for U.S. & Asia:
- Bank of Japan Governor Kuroda speech at 12:30 am GMT (Jan. 15)
- Japan Machine tool orders at 6:00 am GMT (Jan. 15)
What to Watch: NZD/CHF
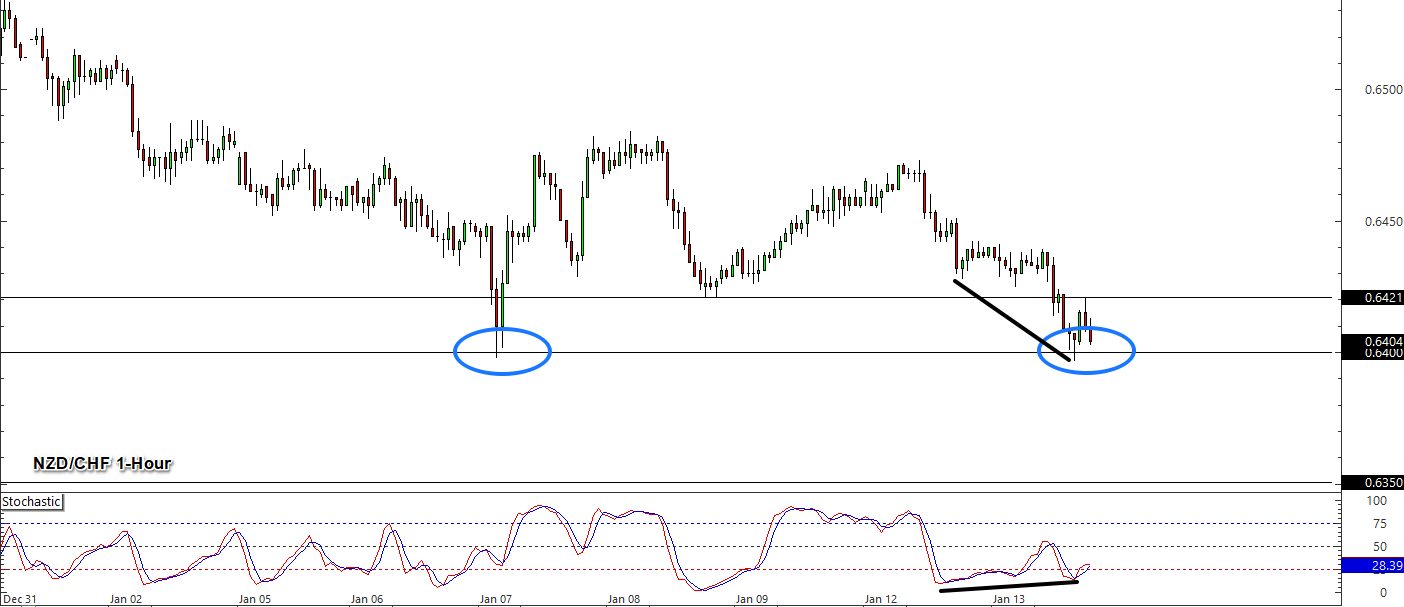
With the markets mostly quiet and no major catalysts ahead, we’re checking out the recent downside momentum in NZD/CHF. Over the last couple of sessions, the pair has made a strong move lower (roughly 75 pips) from its Monday high around 0.6475, a move that is almost a full weekly ATR of around 95 pips in just two sessions. We’re not sure what the driver is for the move but it should be one to watch, especially now that it is testing an inflection point.
The market is currently testing the 0.6400 handle, which is not only a major psychological level, but also a previous support area in which the bulls took control from earlier in the month. Will it be support again? Or will the bears finally have enough to break lower and continue the downside momentum?
Well, a technical argument could be made that the bullish divergence between the stochastic and the price action is a signal of another bounce ahead. Pair that with the broad global risk-on sentiment that we’re seeing from the improving U.S.-China trade story and fading Middle East conflict fears, and there’s an argument for a good probability of success for a long position short term.
For the bears, the momentum is currently on your side, and when zooming out to the higher time frames like the daily chart, it looks like recent price action is confirming a reversal back to the longer-term downtrend that started way back in February 2017 when the pair was peaking around 0.7300.


