


AUD/USD bulls have been in steady control since the new month kicked off, but that move may be running out of steam. Will the upcoming Aussie, Chinese and U.S. data give the bulls legs to run, or is it time for the bears to take back control?
Intermarket Snapshot
| Equity Markets | Bond Yields | Commodities & Crypto |
| DAX: 12272.28 +0.38% FTSE: 7246.48 +0.15% S&P 500: 2963.01 -0.52% DJIA: 26763.86 -0.27% |
US 10-yr 1.664% +0.042 Bund 10-YR -0.561% +0.021 UK 10-YR: 0.63% +0.039 JPN 10-YR: -0.223% +0.037 |
Oil: 57.62 +1.95% Gold: 1514.80 -0.05% Bitcoin: 10217.00 -1.18% Etherium: 179.86 -0.93% |
Fresh Market Headlines & Economic Data:
- Oil rises for fifth day on expectations of extended output cuts
- The number of U.S. job openings was little changed at 7.2M on the last business day of July
- The trend in Canadian housing starts was 218,998 units in Aug. 2019, compared to 208,931 units in Jul. 2019, according to CMHC
- China factory deflation deepens signaling worsening economic slowdown
- The NFIB U.S. Small Business Optimism Index fell 1.6 points to 103.1 vs. 104.7 previous
- Britain is not seeking Northern Ireland-only backstop: PM Johnson’s spokesman
- Carney says Brexit-hit pound looks like emerging market currency
- French industrial output up 0.3% in July, undershooting forecasts
- Bond yields climb as ECB stimulus expectations fade
- Australian business confidence and conditions declined in the month, with both now at +1 index point
Upcoming Potential Catalysts on the Forex Calendar:
- New Zealand Visitor arrivals at 11:45 pm GMT
- Australia Consumer sentiment at 1:30 am GMT (Sept. 11)
- China Foreign investment, new loans, M2 money supply (tentative Sept. 11)
- Canada Capacity utilization rate at 1:30 pm GMT (Sept. 11)
- U.S. PPI at 1:30 pm GMT (Sept. 11)
- U.S. Wholesale inventories at 3:00 pm GMT (Sept. 11)
What to Watch: AUD/USD
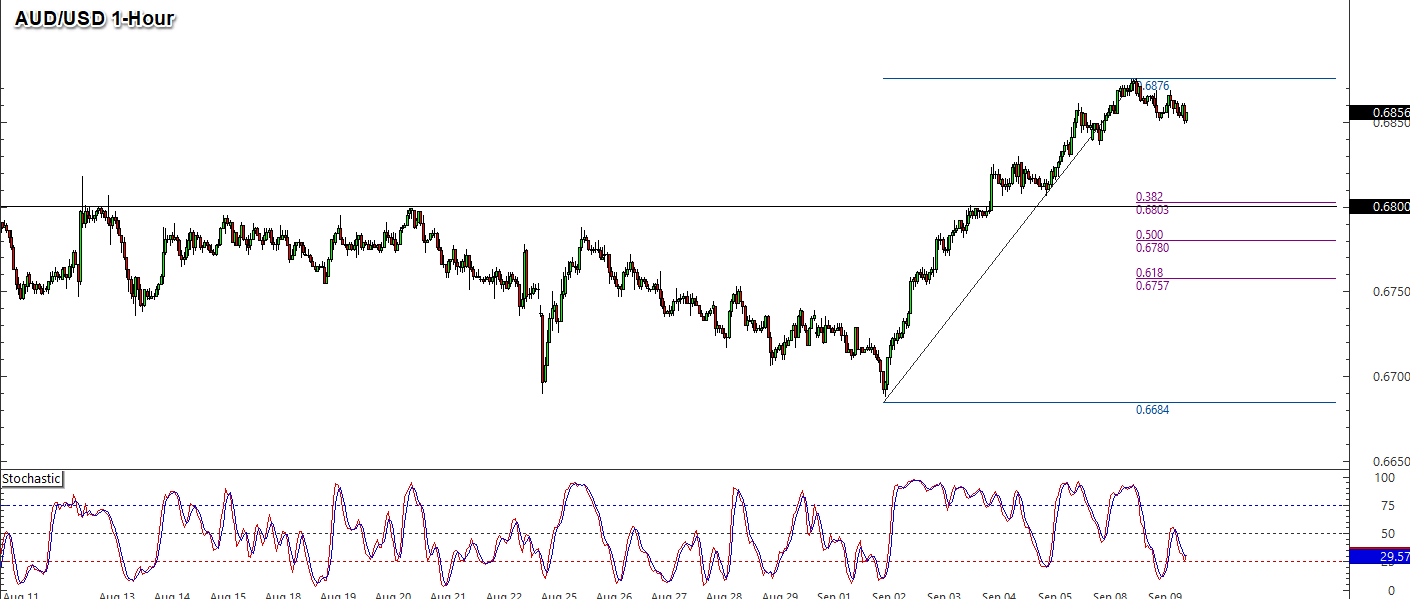
Today, we’ve got AUD/USD at the top of the watchlist as we’ll get a slew of economic updates from Australia, China and the U.S. The Chinese & U.S. data are likely to be the catalysts for volatility in AUD/USD, but you can’t count out Westpac’s consumer sentiment survey data as it has been a short-term market mover at times in the past.
In terms of price action, AUD/USD has been on a heck of a rally in September after its slow grind lower in August. During that rally, we saw the pair break a strong resistance area around 0.6800, and if the upcoming data drives the pair lower to that broken resistance area, support could form as it will also be a Fibonacci retracement level. So, if you’re a bull on AUD/USD, the best risk-to-reward / high probability setup is to wait for a pullback and retest of 0.6800. This is especially crucial in case Chinese data continues to disappoint, then we’d have to see if 0.6800 can hold off the bears.
If you’re a bear on AUD/USD, then the longer-term trend is your friend and the possibility of more weak data from China like what we saw earlier today, plus a positive U.S. PPI number could send this pair lower back into the downtrend. And you can setup for both long and short time frames as the distance to the broken support level 0.6800 is within the daily ATR for a solid short-term gain, while a longer-term potential return-on-risk is pretty good if using the weekly ATR of around 110 pips as the stop guide, while targeting the swing lows around 0.6700, over 160 pips away from current levels.


