


Markets surged on Tuesday as renewed optimism around US-Iran peace negotiations drove a broad risk-on wave, sending equities toward record highs and pulling oil prices sharply lower. Softer-than-expected U.S. producer price data reinforced the positive tone, adding further pressure on the dollar as traders repositioned around the possibility of a diplomatic off-ramp to the more-than-six-week-old conflict. At the Tuesday close, the dollar finished as the worst-performing major currency, while equities extended their recovery toward late-January peaks.
Check out the forex news and economic updates you may have missed in the latest trading session!
Forex News Headlines & Data:
- U.S. Vice President Vance said US-Iran talks made “a lot of progress” and that a broader deal remains possible, with the “ball in Iran’s court”; separate reports indicated a second round of talks may be held as early as Thursday
- Australia Westpac Consumer Confidence Change for April 2026: -12.5% (-1.8% forecast; 1.2% previous)
- Australia NAB Business Confidence for March 2026: -29.0 (-6.0 forecast; -1.0 previous)
- China Balance of Trade for March 2026: 51.13B (105.0B forecast; 213.62B previous)
- Japan Industrial Production Final for February 2026: -2.0% m/m (-2.1% m/m forecast; 4.3% m/m previous); 0.4% y/y (0.3% y/y forecast; 0.7% y/y previous)
- Germany Wholesale Prices for March 2026: 2.7% m/m (0.4% m/m forecast; 0.6% m/m previous); 4.1% y/y (1.0% y/y forecast; 1.2% y/y previous)
- U.S. NFIB Business Optimism Index for March 2026: 95.8 (97.0 forecast; 98.8 previous)
- U.S. ADP Employment Change Weekly for March 28, 2026: 39.0k (26.0k previous)
- U.S. PPI for March 2026: 0.5% m/m (1.3% m/m forecast; 0.7% m/m previous); 4.0% y/y (4.4% y/y forecast; 3.4% y/y previous)
Broad Market Price Action:
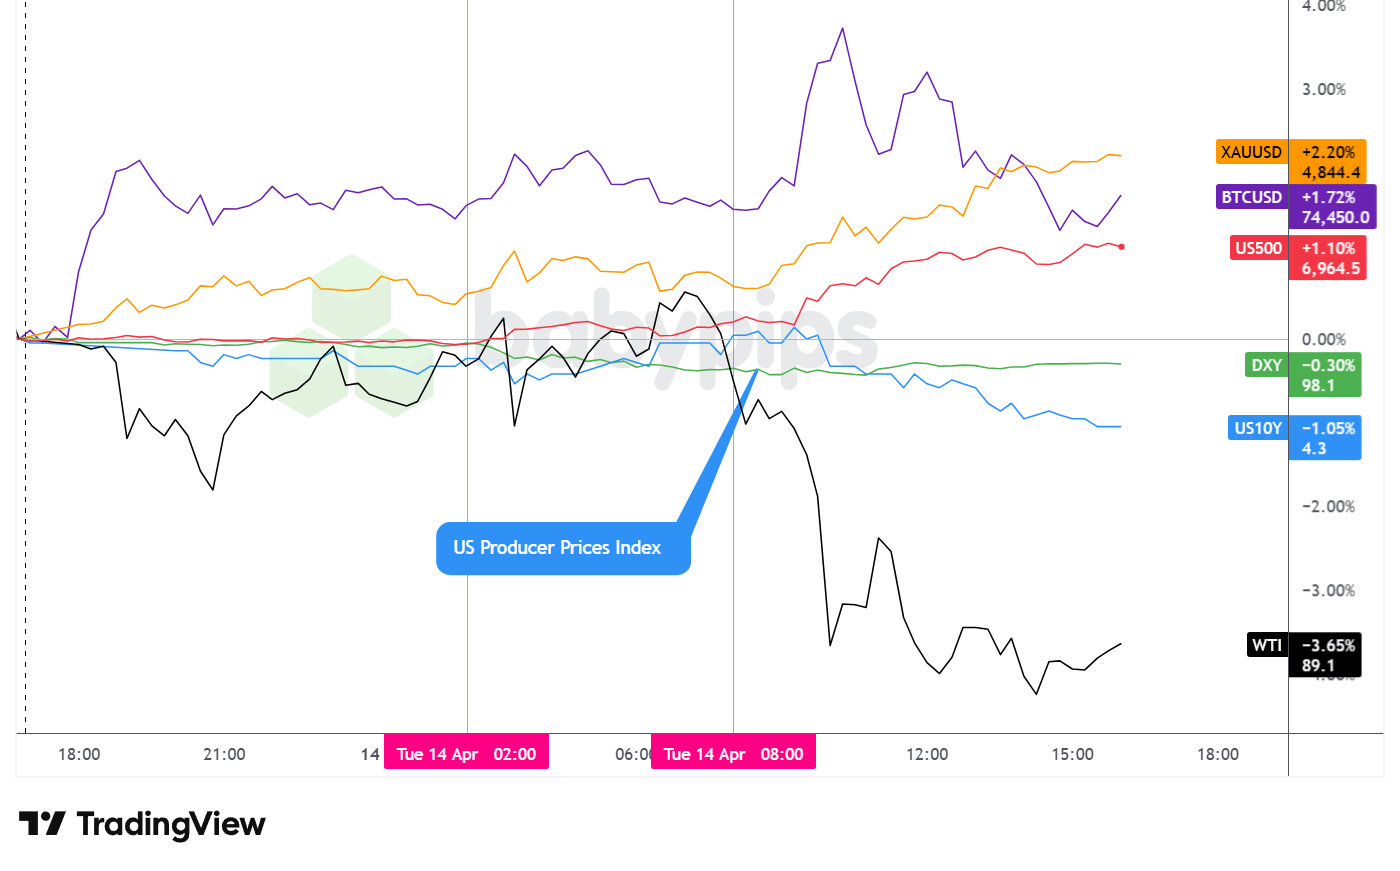
Dollar Index, Gold, Oil, S&P 500, U.S. 10-yr Yield, Bitcoin Overlay – Chart Faster With TradingView
Tuesday delivered a broadly coordinated risk-on session, with peace talk optimism and soft upstream inflation data working in tandem to lift equities, pressure oil, weaken the dollar, and push Treasury yields lower. The session’s price action was largely geopolitically driven, with the PPI release providing a secondary catalyst that reinforced moves already in motion.
The S&P 500 closed up approximately 1.08% to around 6,962, extending a rebound that has brought the index within striking distance of its late-January record peak. Price action was largely sideways through the Asia and London sessions before a sharp surge at the US open, coinciding with the soft PPI print. The index pressed toward intraday highs near 6,970 before easing modestly into the close. Diplomatic headlines provided the broader backdrop, with Vice President Vance’s constructive comments on Iran talks likely reinforcing the underlying bullish posture. On the earnings front, BlackRock reported $130 billion in Q1 net inflows and its shares rose approximately 3%, while Citigroup climbed on its highest quarterly return on tangible common equity in five years. JPMorgan shares slipped despite record quarterly trading revenue, underscoring that the bar for Q1 earnings reactions remains elevated.
WTI crude oil posted the session’s steepest loss, declining approximately 3.52% to close near $89.18 per barrel. Oil had traded in a relatively contained range through the Asian and London sessions before dropping sharply at the US open, with the move accelerating through mid-morning. The selloff appeared to correlate with the convergence of diplomatic optimism — including reports of tankers transiting the Strait of Hormuz on the first day of the US blockade — and the IEA’s estimate that the war will eliminate global oil demand growth for the first time since the 2020 pandemic. The soft PPI data may have further dampened near-term inflation expectations linked to energy costs, contributing to additional selling pressure.
Gold extended its recent strength, closing up approximately 1.70% near $4,840 per ounce. The precious metal grinded steadily higher across all three sessions, finding consistent demand despite the broadly risk-on tone in equities. The concurrent strength in both gold and stocks may reflect a market that is pricing in diplomatic progress while retaining partial hedges against a potential breakdown in negotiations, though the precise driver is uncertain. The advance is worth noting given that a purely risk-on environment might typically be expected to temper demand for safe-haven assets.
Bitcoin closed higher on the day, finishing near $74,300. The price action was notably volatile intraday: Bitcoin surged sharply in the early Asia session, stabilized through Asia and early London hours, then saw plenty of choppy price action during the US session. There were no notable crypto drivers to point to, so broad risk-on vibes was the likely driver, and by the close, Bitcoin’s was one of the top performing major assets on the session.
The 10-year Treasury yield declined approximately 1.05%, settling near 4.25%. Yields were broadly sideways through the Asian and London sessions before dropping sharply at the US open alongside the soft PPI release. The bond market move was consistent with a repricing of near-term inflation expectations lower, and the combination of falling yields and rising equities suggested traders interpreted the PPI data and diplomatic headlines as broadly reducing tail risks in the near term.
Promoted: Don’t Just Survive the Hormuz Whipsaw. Trade It.
Tuesday’s session was a masterclass in geopolitical volatility — oil cratered 3.5%, the dollar shed ground against every major, and equities ripped to near-record highs, all on the back of a single diplomatic headline and a softer-than-expected PPI print. If you read the risk-on pivot correctly and executed with precision, the only thing standing between you and a bigger payday was account size.
That’s where Tradeify comes in. Their Lightning accounts offer instant funding with no evaluation phase — so when the next catalyst hits (ECB Lagarde speaks twice tomorrow, and Strait of Hormuz inventory data drops Wednesday afternoon), you’re trading at the size your edge deserves.
Get Instant Funding with Tradeify!
Disclosure: We may earn a commission from our partners if you sign up through our links, at no extra cost to you.
FX Market Behavior: U.S. Dollar vs. Majors
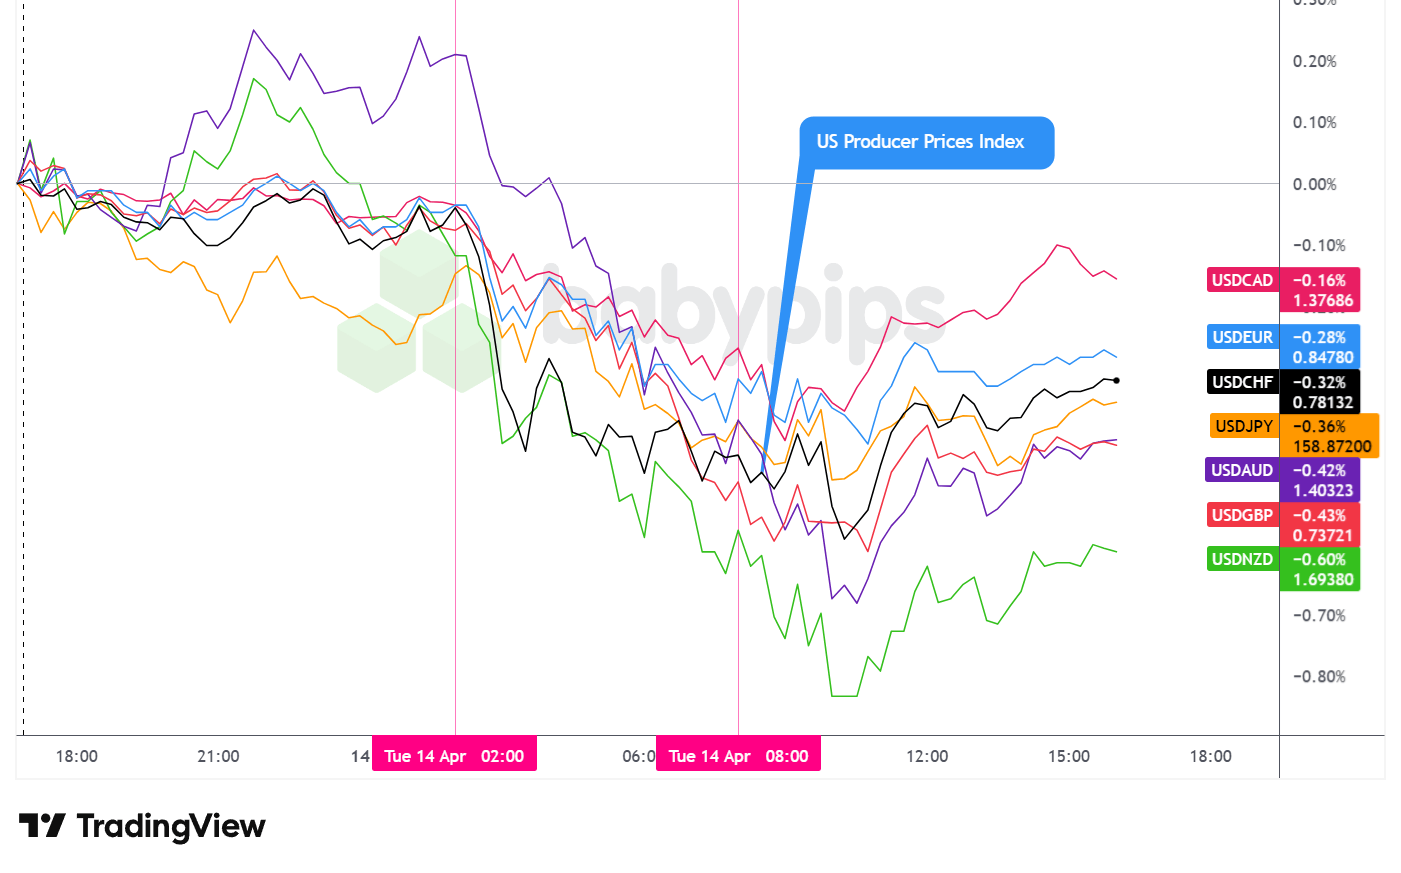
Overlay of USD vs. Majors – Chart Faster With TradingView
The U.S. dollar closed Tuesday as the worst-performing major currency, posting losses against all seven peers tracked on the overlay chart above. Price action followed a coherent arc: a mixed but net bearish Asian session gave way to broad uniform selling through London morning trade and into the US open, before the dollar found an intraday floor and staged a modest partial recovery through the afternoon.
During the Asian session, the dollar traded mixed with an arguably net bearish bias against the majors. The mixed behavior was shaped by not only improving geopolitical developments as discussed above, but possibly on several weak data prints and central bank developments. Australia’s NAB Business Confidence collapsed to -29 from -1 previously, one of the sharpest single-period declines on record, reflecting the direct shock of the Iran conflict on business outlooks. China’s March trade data delivered a striking divergence: imports surged 27.8% year-over-year amid energy-driven cost pressures while exports grew only 2.5%, compressing the trade surplus dramatically to 51.13 billion from $213.62 billion prior.
The London session brought more uniform and accelerating bearish pressure. As European traders came online, the greenback extended losses across all major pairs through the morning hours and into the US open. The European data slate was light and unlikely to have been the primary driver — ECB’s Rehn reiterated that rate decisions are not pre-set, Spain’s final March CPI was revised marginally higher, and Germany’s wholesale prices printed dramatically above forecast. The dominant force appeared to be continued unwinding of geopolitical risk premium as diplomatic reports circulated, with the dollar bearing the brunt of the resulting repositioning.
Shortly after the US session opened, the dollar found an intraday bottom and began to stabilize. The PPI release came in well below expectations — headline at +0.5% m/m versus +1.3% forecast, and core at just +0.1% m/m versus +0.5% expected — which initially extended dollar weakness before buying interest emerged. The dollar gradually recovered from its lows through the remainder of the session, possibly reflecting near-term peak positioning and intraday short-covering, though the recovery was modest rather than decisive.
Upcoming Potential Catalysts on the Economic Calendar
- U.S. API Crude Oil Stock Change for April 10, 2026 at 8:30 pm GMT
- ECB President Lagarde Speech at 9:00 pm GMT
- Japan Machinery Orders for February 2026 at 11:50 pm GMT
- France CPI Growth Rate Final for March 2026 at 6:45 am GMT
- ECB Rehn Speech at 8:00 am GMT
- Euro area Industrial Production for February 2026 at 9:00 am GMT
- U.S. MBA 30-Year Mortgage Rate for April 10, 2026 at 11:00 am GMT
- Canada Manufacturing & Wholesale Sales Final for February 2026 at 12:30 pm GMT
- NY Empire State Manufacturing Index for April 2026 at 12:30 pm GMT
- U.S. Import & Export Prices for March 2026 at 12:30 pm GMT
- Fed Barr Speech at 12:30 pm GMT
- U.S. NAHB Housing Market Index for April 2026 at 2:00 pm GMT
- EIA Crude Oil Stocks Change for April 10, 2026 at 2:30 pm GMT
- Fed Bowman Speech at 5:45 pm GMT
- BoE Gov Bailey Speech at 6:00 pm GMT
- U.S. Fed Beige Book at 6:00 pm GMT
- Euro area ECB President Lagarde Speech at 7:30 pm GMT
- Euro area ECB Schnabel Speech at 8:00 pm GMT
Wednesday’s calendar is heavily weighted toward central bank commentary, with ECB President Lagarde scheduled for two appearances alongside additional remarks from Rehn and Schnabel.
Given Tuesday’s backdrop of elevated energy costs and diplomatic uncertainty, markets will be watching closely for any ECB signals on how policymakers are weighing the competing pressures of energy-driven inflation and slowing growth — a tension flagged explicitly by the RBA’s Hauser as a stagflation risk.
On the US side, Fed speakers Barr and Bowman could influence near-term rate expectations if they address Tuesday’s soft PPI figures or offer updated views on whether the Iran conflict’s inflation pass-through is materializing as feared. The NY Empire State Manufacturing Index and Import/Export Prices will add data points on domestic activity and price dynamics.
The EIA crude oil stocks release and API data will be closely monitored in the context of evolving Strait of Hormuz developments, and any notable shift in US inventory levels could amplify or offset the oil price moves seen on Tuesday.
BoE Governor Bailey’s evening speech may attract attention from sterling traders, particularly as the UK navigates the combined pressures of elevated energy costs and a fragile consumer backdrop.
Stay frosty out there, forex friends!
Promoted: The Strategy is Half the Battle; Your Mindset is the Rest.
Most trading mistakes aren’t technical—they’re psychological. In the classic “Trading in the Zone” by Mark Douglas (⭐ 4.7★ | 10,000+ reviews on Amazon), you’ll learn how to master the probabilistic thinking and emotional discipline mentioned in today’s article. If you struggle with hesitation or breaking your rules, this is your manual for consistent execution.
Click on the link to learn more about “Trading in the Zone” by Mark Douglas!
Disclosure: To help support our content, we may earn a commission from our partners if you sign up through our links, at no extra cost to you.


