


Risk-on optimism over a potential end to the U.S.-Iran conflict drove equities higher and crude oil sharply lower on Wednesday, while U.S. economic data continued to surprise to the upside and the dollar pulled back broadly against major currencies.
A hotter-than-expected ISM manufacturing prices component and a beat in retail sales underscored resilient U.S. demand, though the geopolitical narrative around Middle East de-escalation remained the dominant market driver heading into Trump’s scheduled prime-time address after the close.
Check out the forex news and economic updates you may have missed in the latest trading session!
Forex News Headlines & Data:
- New Zealand Building Permits for February 2026: 2.7% m/m (4.5% m/m forecast; 1.9% m/m previous)
- Australia S&P Global Manufacturing PMI Final for March 2026: 49.8 (50.1 forecast; 51.0 previous)
- Japan Tankan Large Manufacturers Index for March 31, 2026: 17.0 (14.0 forecast; 15.0 previous)
- Australia Building Permits Prel for February 2026: 14.0% y/y (-12.0% y/y forecast; -15.7% y/y previous); 29.7% m/m (4.5% m/m forecast; -7.2% m/m previous)
- Japan S&P Global Manufacturing PMI Final for March 2026: 51.6 (51.4 forecast; 53.0 previous)
- China RatingDog Manufacturing PMI for March 2026: 50.8 (51.7 forecast; 52.1 previous)
- Swiss Retail Sales for February 2026: 0.4% m/m (0.1% m/m forecast; 1.1% m/m previous); 0.9% y/y (1.2% y/y forecast; -1.1% y/y previous)
- Swiss procure.ch Manufacturing PMI for March 2026: 53.3 (47.2 forecast; 47.4 previous)
- Euro area S&P Global Manufacturing PMI Final for March 2026: 51.6 (51.4 forecast; 50.8 previous)
- U.K. S&P Global Manufacturing PMI Final for March 2026: 51.0 (51.4 forecast; 51.7 previous)
- Euro area Unemployment Rate for February 2026: 6.2% (6.1% forecast; 6.1% previous)
- U.S. MBA Mortgage Applications for March 27, 2026: -10.4% (-10.5% previous)
- U.S. MBA 30-Year Mortgage Rate for March 27, 2026: 6.57% (6.43% previous)
- U.S. ADP National Employment Report for March 2026: 62.0k (40.0k forecast; 63.0k previous)
- U.S. Retail Sales for February 2026: 0.6% m/m (0.3% m/m forecast; 0.0% m/m previous); 3.7% y/y (2.9% y/y forecast; 3.2% y/y previous)
- Canada S&P Global Manufacturing PMI for March 2026: 50.0 (49.2 forecast; 51.0 previous)
- U.S. S&P Global Manufacturing PMI Final for March 2026: 52.3 (52.4 forecast; 51.6 previous)
- U.S. ISM Manufacturing PMI for March 2026: 52.7 (52.0 forecast; 52.4 previous)
- U.S. EIA Crude Oil Stocks Change for March 27, 2026: 5.45M (6.93M previous)
Promotion: Use TradeZella’s AI Powered trade journal to deep-dive into your execution and see exactly how you performed during today’s trading session.
Click here to get the TradeZella Edge and use code PIPS20 to save 20% on your first purchase!
Disclosure: We may earn a commission from our partners if you sign up through our links, at no extra cost to you.
Broad Market Price Action:
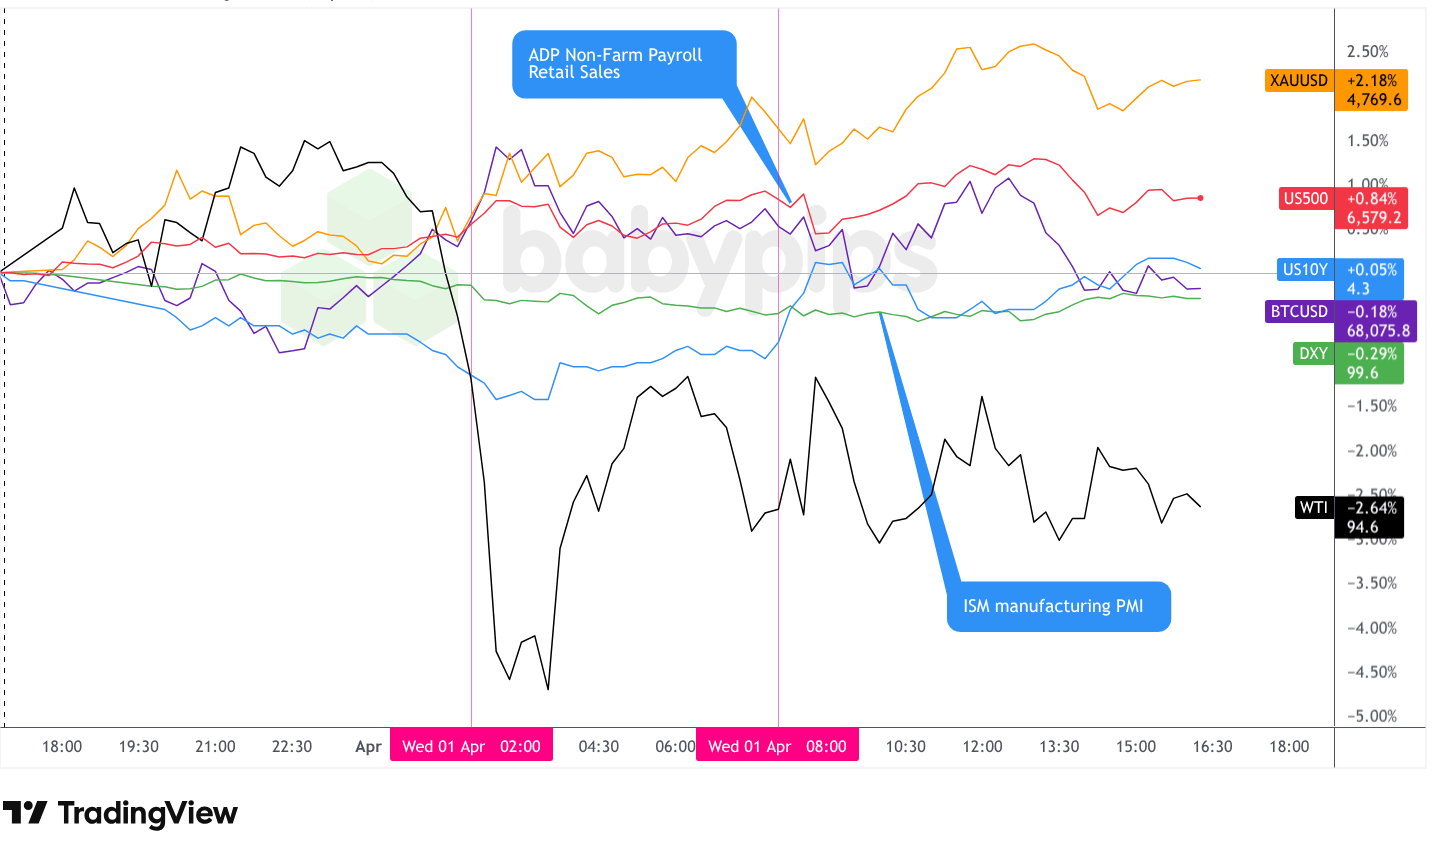
Dollar Index, Gold, Oil, S&P 500, U.S. 10-yr Yield, Bitcoin Overlay – Chart Faster With TradingView
Wednesday’s broad market session was defined by a sharp divergence between risk assets and energy. Equities extended their two-day recovery as investors priced in growing optimism around a near-term end to U.S. military operations in Iran, while WTI crude fell sharply on de-escalation hopes — even as on-the-ground developments continued to point to active hostilities. Stronger-than-expected U.S. economic data reinforced resilience in domestic demand, though the ISM prices component’s surge raised fresh inflation concerns.
The S&P 500 closed up approximately 0.76%, settling near 6,574. The index climbed steadily through the Asian and early London sessions before pushing higher at the U.S. open, reaching an intraday peak near 6,610. Price action softened through the early afternoon, with the index pulling back toward the 6,555-6,575 area before settling into the close. Gains were broad-based, with travel, mining, and technology stocks among the leaders, though Nike tumbled more than 15% on a gloomy forward outlook. Some analysts cautioned that the sharp two-day recovery may have reflected the unwinding of bearish positioning more than a fundamental shift in sentiment, noting that any mixed or negative developments at elevated levels could quickly reverse the move.
Gold advanced for a fourth consecutive day, closing near $4,760, up approximately 1.35% on the session. The metal drifted modestly lower during the early Asian hours before building upward momentum through the London session and into the U.S. afternoon. Gold’s continued strength even as risk assets rallied was an unusual divergence, possibly suggesting some traders maintained safe-haven hedges ahead of Trump’s scheduled prime-time address and amid conflicting signals on the conflict’s trajectory. Mining stocks tracked the metal’s strength.
WTI crude oil was the session’s clear underperformer, falling approximately 2.64% to close near $94.60. The sharp decline began around the London open as markets priced in the “mission completion” narrative from Washington, with Trump having said on Tuesday that the U.S. could exit within two to three weeks. Brent briefly dipped below $100 per barrel during the session. The drop came despite a notably large API crude stock build of 10.26 million barrels reported overnight and an EIA inventory build of 5.45 million barrels — both of which would ordinarily weigh on prices and may have exacerbated the decline. However, participants cautioned that even a near-term ceasefire may not quickly restore normal oil flows, particularly given damage to regional energy infrastructure, and the IEA chief warned that April supply losses are on track to double those recorded in March.
Bitcoin closed slightly lower, down approximately 0.18% near $68,075. The cryptocurrency spiked sharply to the upside at the London open, briefly approaching $69,200, before reversing most of those gains during the U.S. session. Bitcoin’s failure to hold its early rally — even as equities closed higher — may reflect profit-taking or a divergence in risk appetite between traditional and digital asset markets.
The U.S. 10-year Treasury yield closed near 4.338%, up approximately 0.46% on the day, ending a multi-session drift lower. Yields had trended down through the Asian and early London sessions before spiking sharply higher at the U.S. open, likely correlating with the stronger-than-expected ADP and retail sales data. The ISM manufacturing report added to the upward yield pressure, with the headline PMI beating at 52.7 and the prices-paid component surging to 78.3 versus 73.0 expected — a reading that may reinforce concerns about persistent manufacturing-side inflation and complicate the Fed’s policy calculus.
Promoted: Capitalize on News Catalysts Without Risking Your Own Funds.
Today, oil dropped once again on prospects for military de-escalation. On a small personal account, riding that kind of move means trading tiny position sizes that barely move the needle.
Alpha Capital Group changes the math. By providing access to simulated funded accounts from $5K to $200K, starting at $50, you can execute high-conviction setups with the professional position sizing they deserve. Join 250K+ traders in 180+ countries today!
Learn more about Alpha Capital Group!
Disclosure: We may earn a commission from our partners if you sign up through our links, at no extra cost to you.
FX Market Behavior: U.S. Dollar vs. Majors
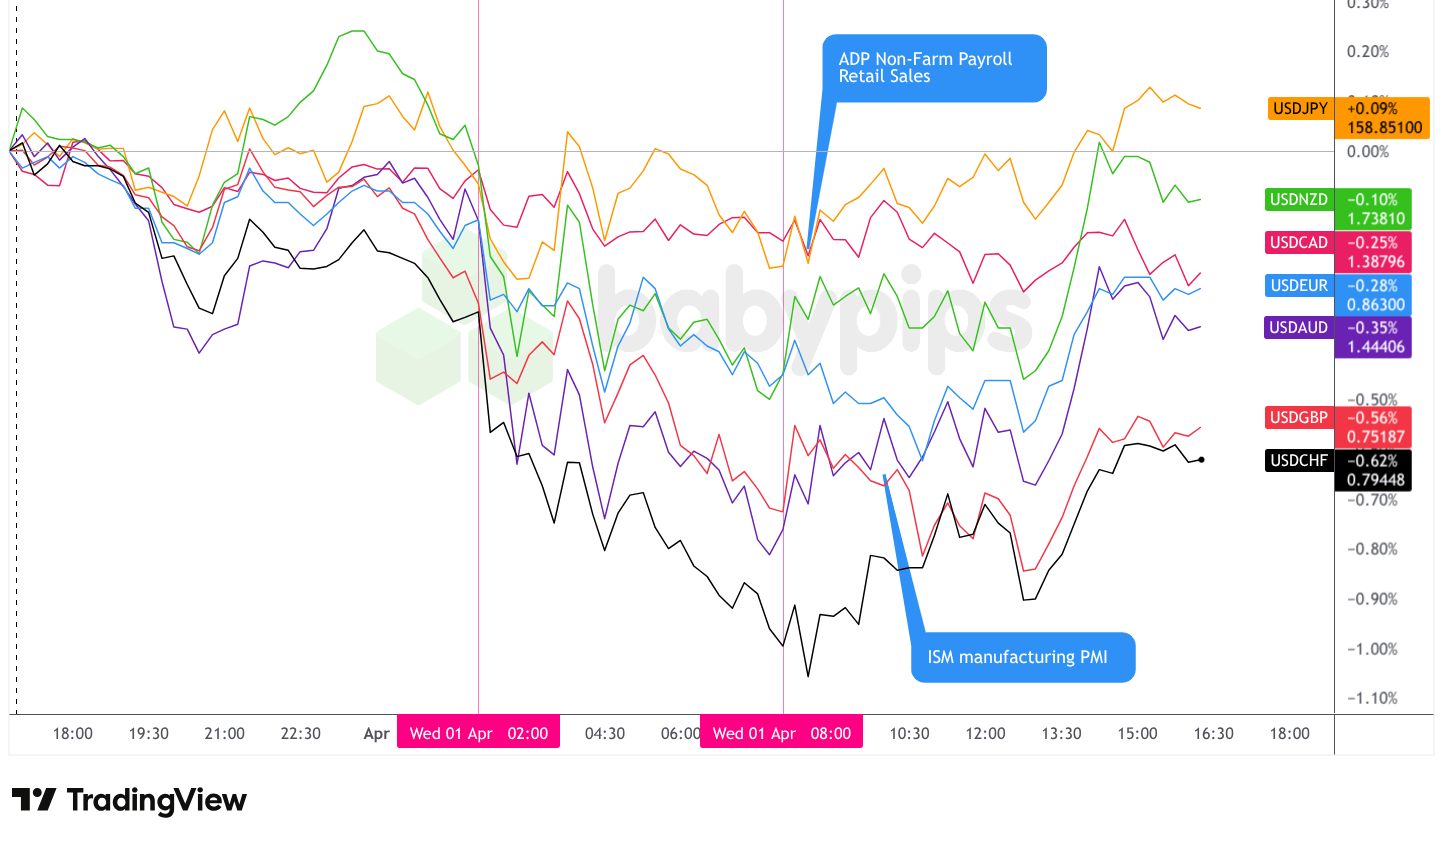
Overlay of USD vs. Majors – Chart Faster With TradingView
The U.S. dollar traded with a choppy but net bearish bias throughout Wednesday, pulling back against nearly all major currencies as risk-on sentiment built around Middle East de-escalation optimism. By the close, the greenback was the session’s net underperformer, recording gains only against the Japanese yen.
During the Asian session, the dollar traded with a choppy but bearish bias against the major currencies, with no single dominant catalyst pointing to a clean directional driver. The session’s backdrop included a beat in Japan’s Tankan large manufacturers index (17 vs. 14 forecast), its highest reading since 2021, though forward-looking indicators softened and profit expectations declined — a mixed outcome that likely tempered any yen-bullish follow-through. China’s manufacturing PMI slowed to 50.8 from 52.1, missing the 51.7 forecast, while Australian data broadly disappointed across construction, industry, and manufacturing. Despite the weak regional data, the Aussie dollar appeared to find support in a dramatic upside surprise in Australia’s commodity price index (12.8% y/y vs. 4.8% forecast), likely reflecting elevated global energy and materials prices tied to ongoing Middle East supply disruptions.
After the London session opened, the dollar continued to trade lower against the major currencies. The primary driver appeared to be broad risk-on positioning as European traders leaned into optimism ahead of Trump’s prime-time address, with markets largely anticipating a message pointing toward conflict resolution. European manufacturing PMI finals came in mostly above preliminary estimates, particularly Germany at 52.2 versus 51.7 — contributing to a constructive EUR backdrop. The Eurozone unemployment rate edged slightly higher to 6.2%, a mild miss against the 6.1% consensus, though this did not appear to weigh materially on euro sentiment. A standout was Switzerland’s procure.ch manufacturing PMI, which dramatically beat expectations at 53.3 versus 47.2 forecast — a large beat that likely contributed to franc strength and helped push USDCHF toward the session’s weakest dollar readings.
After the U.S. session opened, the dollar re-stabilized against the major currencies before seeing a slight rebound during the afternoon. A busy run of U.S. data came in broadly stronger than expected. ADP employment for March printed at 62K versus 40K forecast, retail sales for February beat at 0.6% m/m versus 0.3% expected, and the ISM manufacturing PMI came in at 52.7 versus 52.0, with the prices-paid component surging to 78.3 — well above the 73.0 forecast and the 70.5 prior reading. The stronger data appeared to provide the dollar with some underlying support, though the afternoon recovery was modest, suggesting the day’s dominant risk-on and geopolitical narrative outweighed the data impulse.
Upcoming Potential Catalysts on the Economic Calendar
- Australia Balance of Trade for February 2026 at 12:30 am GMT
- U.S. President Trump Speech at 1:00 am GMT
- Swiss CPI Growth Rate for March 2026 at 6:30 am GMT
- U.S. Challenger Job Cuts for March 2026 at 11:30 am GMT
- Canada Balance of Trade for February 2026 at 12:30 pm GMT
- U.S. Goods Trade Balance Adv for February 2026 at 12:30 pm GMT
- U.S. Initial Jobless Claims for March 28, 2026 at 12:30 pm GMT
- U.S. Balance of Trade for February 2026 at 12:30 pm GMT
- U.S. EIA Natural Gas Stocks Change for March 27, 2026 at 2:30 pm GMT
- U.S. Fed Logan Speech at 3:00 pm GMT
Thursday’s calendar is headlined by President Trump’s 1:00 am GMT prime-time address, which markets are already treating as a key directional signal for the conflict’s trajectory. Any language pointing toward imminent military disengagement — or, conversely, an escalation caveat — could drive sharp moves in crude oil, equities, safe-haven currencies, and gold.
Switzerland’s March inflation rate at 6:30 am GMT arrives in the context of the franc’s notable intraday strength Wednesday and will be watched for any repricing of SNB expectations.
The U.S. session brings a cluster of trade balance data and initial jobless claims, where a continuation of recent labor market resilience may reinforce the case for the Fed to hold steady at its next meeting. Fed’s Logan is scheduled to speak at 3:00 pm GMT, and any commentary on the inflation outlook — particularly following today’s hot ISM prices-paid reading — may attract attention.
Stay frosty out there, forex friends!
Promotion: Today’s Session Was an Opportunity to Practice Emotional Discipline. Were You Ready for It?
Wednesday’s session flipped the script in real time. Oil dropped like a rock while equities and gold ripped higher. The dollar finally caught a selling wave.
If you were positioned before today’s headlines and data broke, you faced the choice most traders fumble: hold, flip, or freeze?
In Positive Trading Psychology, renowned psychologist Brett Steenbarger argues that surviving sessions like today isn’t about eliminating emotional responses — it’s about channeling your character strengths to stay clinical when everyone else is reacting to the next headline. When a war-risk premium can reverse in a single news cycle, your psychology isn’t a soft edge. It’s your hardest one.
Learn more about “Positive Trading Psychology: Turning personal strengths into trading strengths” on Amazon!
Disclosure: We may earn a commission from our partners if you sign up through our links, at no extra cost to you.


