


The May U.S. CPI reflected hotter-than-expected headline inflation, while core price pressures appeared subdued. Meanwhile, geopolitical developments remained fluid, creating a tricky macro backdrop for dollar trades.
Let’s look at which setup from our watchlist ideas had a path to a clean trade.
Watchlists are price outlook & strategy discussions supported by both fundamental & technical analysis, a crucial step towards creating a high-quality discretionary trade idea before working on a risk & trade management plan.
If you’d like to follow our “Watchlist” picks right when they are published throughout the week, check out our BabyPips Premium subscribe page to learn more!
The Setup
What We Were Watching: U.S. CPI (May 2026)
- Expectation: May headline CPI to show 0.3% m/m uptick, annual reading to climb from 3.8% to 4.0%; core CPI to rise 0.3% m/m vs. earlier 0.4% gain but year-over-year figure to rise from 2.8% to 2.9%
- Market environment surrounding the event: The risk backdrop was characterized by rapidly shifting dynamics surrounding the US-Iran conflict. Tuesday saw geopolitical flare-ups after a brief ceasefire optimism, with Trump blaming Iran for a helicopter shoot-down over the Strait of Hormuz and U.S. forces launching a second night of strikes the next day.
Event Outcome
The U.S. CPI came in slightly above expectations for May, as annual headline inflation rose from 3.8% to a three-year high of 4.2% while core CPI landed at 2.9%.
The headline beat was heavily driven by energy, where gasoline surged 7.0% on the month, and the energy index as a whole rose 23.5% year-over-year as ongoing U.S.-Iran hostilities kept crude oil elevated through May.
Key Takeaways:
- Headline CPI (m/m): +0.5% — in line with consensus but above the +0.4% consensus forecast noted in some estimates; above the +0.4% prevailing expectation
- Headline CPI (y/y): +4.2% vs. +4.0% expected; up from +3.8% in April — highest annual reading since April 2023
- Core CPI (m/m): +0.2% vs. +0.3% expected — a downside miss; Core CPI (y/y): +2.9% vs. +2.9% expected — matched forecasts; up from 2.8% in April
- Energy index: +3.9% m/m; +23.5% y/y — accounted for over 60% of the monthly all-items rise; highest since mid-2022
- Gasoline: +7.0% m/m; +40.5% y/y, driven by ongoing U.S.-Iran hostilities pressuring crude prices through May
- Shelter: +0.3% m/m; +3.4% y/y; owners’ equivalent rent +0.3% MoM; primary rent +0.4% MoM — firm but not re-accelerating
- Airline fares: +2.7% m/m; +26.7% y/y — reflecting knock-on effect of elevated jet fuel costs
- Real average hourly earnings: -0.7% y/y — extending the squeeze on household purchasing power into a second consecutive month
The Fed received little in this data to justify near-term rate cuts; the above-forecast headline reinforced higher-for-longer expectations ahead of the June 17 FOMC meeting.
No Fed commentary accompanied this release directly due to the blackout period, but U.S. 10-year Treasury yields rose ~4.5% by afternoon, reflecting a repricing of the cautious Fed outlook
Fundamental Bias Triggered: Bullish USD
Promotion: Top-tier catalysts like the U.S. CPI data can trigger emotional execution.
TradeZella AI powered journal turns your raw data into a high-performance playbook. Sync your broker, replay your trades bar-by-bar, and use the Playbook Designer to ensure that next time an economic data point surprises the market, you’re executing with clinical precision.
Click on the link to learn more and use code “PIPS20” to save 20% off first purchase!
Disclosure: We may earn a commission from our partners if you sign up through our links, at no extra cost to you.
Broad Market and Exogenous Drivers:
Geopolitical Whipsaw (Monday–Tuesday)
The week opened with conflicting geopolitical signals. Following Monday’s Israel-Iran ceasefire call from Trump, Tuesday began with a cautious risk-on posture in Asian markets. China’s May trade data delivered a significant upside surprise, which provided a constructive tone for Asia-Pacific currencies and initially weighed on safe-haven demand for the Greenback.
However, Tuesday’s afternoon session brought a sharp reversal when Trump declared that Iran had shot down a U.S. military helicopter over the Strait of Hormuz and that the U.S. must respond, reigniting escalation fears and triggering a broad risk-off turn.
At the same time, a wave of selling in high-valuation semiconductor and AI-adjacent stocks compounded the pressure as investors grew skeptical about AI-era valuations ahead of the high-profile SpaceX IPO. USD ended Tuesday with a net bearish lean overall but recovered a portion of losses through the New York afternoon on safe-haven demand.
CPI Day and Risk-Off Spillover (Wednesday)
The dollar drifted higher Thursday on residual safe haven demand, while the ECB’s expected 25 bp hike offered no surprise and U.S. PPI delivered a mixed but inflationary read. The main turn came in early North American trade, when Trump canceled planned Iran strikes and said a deal could be signed within days. Equities surged, crude slid to the mid $80s, and the dollar fell to its weekly low.
Friday brought a partial dollar recovery as Strait of Hormuz risks kept markets cautious, briefly lifting DXY to 99.90. The move faded after leaked Iran deal terms were viewed as dollar negative, though a strong University of Michigan sentiment beat and lower inflation expectations helped the greenback recover into the close. DXY still finished the week fractionally lower.
Diplomatic Pivot and Partial Recovery (Thursday – Friday)
The dollar drifted higher Thursday on residual safe haven demand, while the ECB’s expected 25 bp hike offered no surprise and U.S. PPI delivered a mixed but inflationary read. The main turn came in early North American trade, when Trump canceled planned Iran strikes and said a deal could be signed within days. Equities surged, crude slid to the mid $80s, and the dollar fell to its weekly low.
Friday brought a partial dollar recovery as Strait of Hormuz risks kept markets cautious, briefly lifting DXY to 99.90. The move faded after leaked Iran deal terms were viewed as dollar negative, though a strong University of Michigan sentiment beat and lower inflation expectations helped the greenback recover into the close. DXY still finished the week fractionally lower.
Scenario Scorecard: How Did They Play Out?
USD/CHF: Bullish USD Event Outcome + Risk-On Scenario = Arguably good odds of a net positive outcome
USD/CHF 1-hour Forex Chart Faster with TradingView
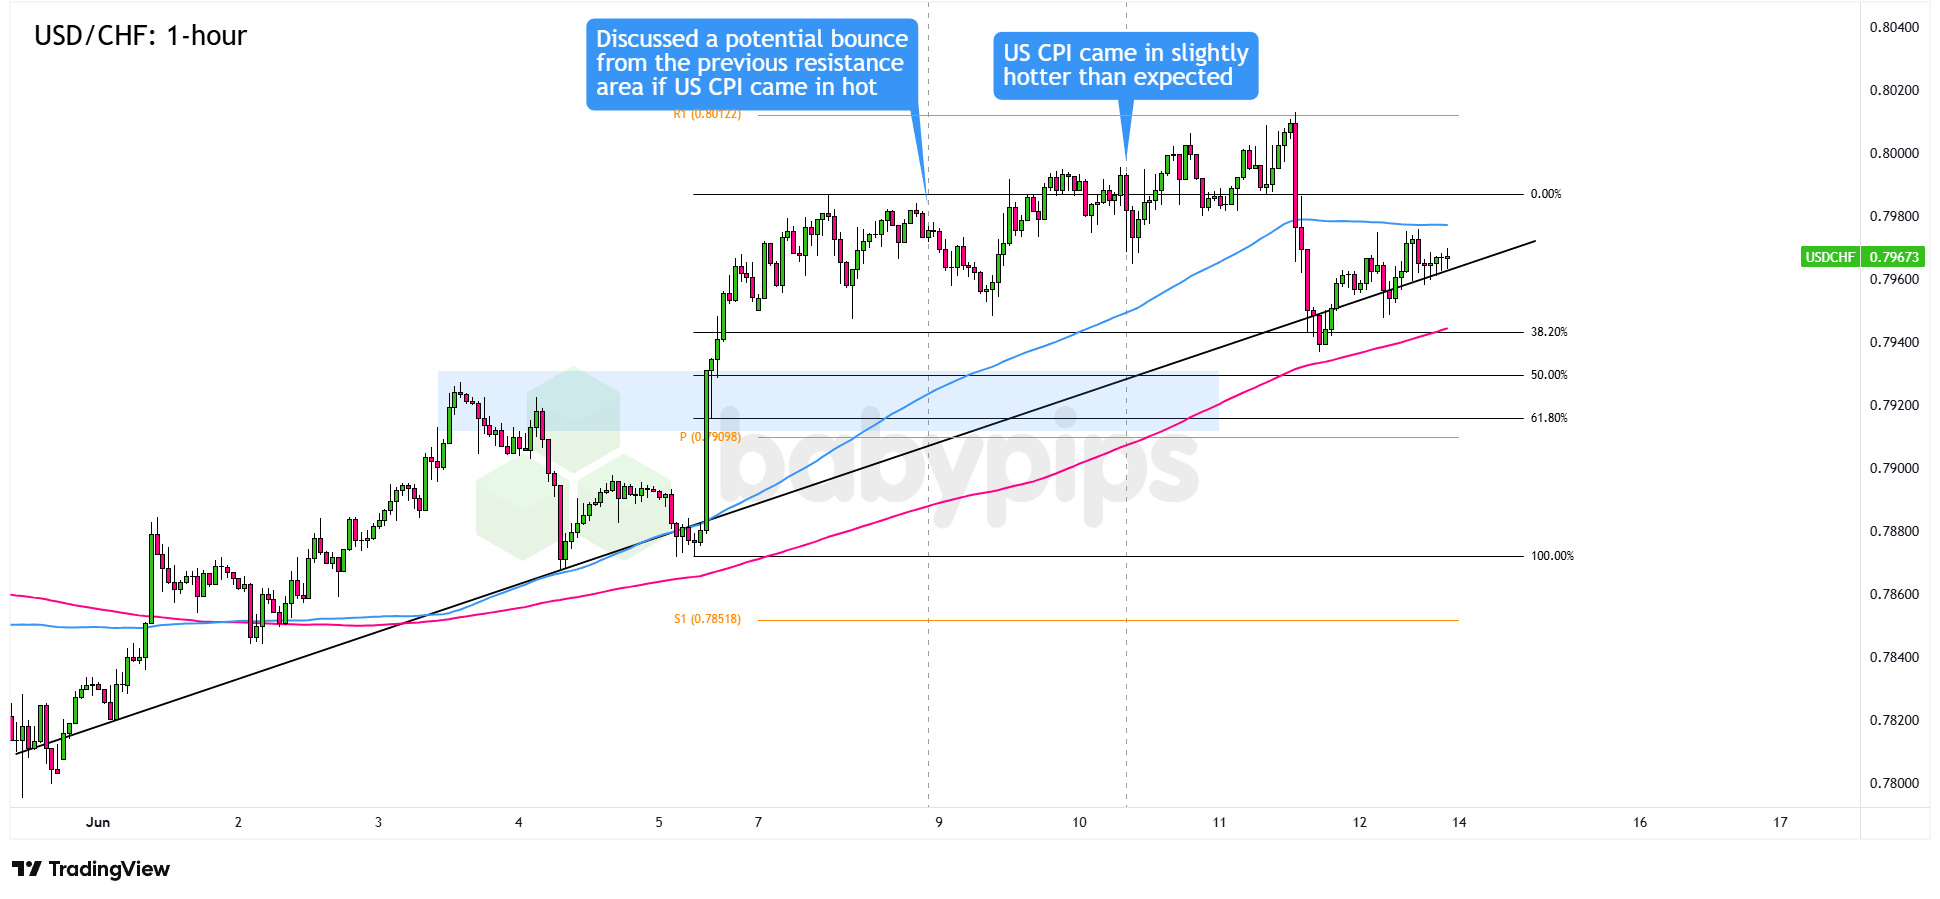
The watchlist called for a potential correction in USD/CHF following the CPI print, with Fibonacci retracement levels tied to the pair’s rising trendline structure flagged as likely support in the event U.S. CPI beat estimates: the 61.8% Fib at the pivot point (.7900) as the primary floor, with the 50% Fib and the 38.2% level near the .7950 minor psychological mark as shallower alternatives. A hold at any of these was expected to set up continuation toward the .7986 swing high and potentially R1 at .8012.
Because the headline CPI beat estimates and the higher-for-longer Fed repricing kept the pair’s fundamental rationale intact, this USD/CHF watchlist discussion was arguably the setup best positioned to move beyond the watchlist stage.
The actual risk environment on CPI day leaned more risk-off than the original scenario envisioned, though with both currencies carrying safe-haven status, the hot CPI print’s impact on real yield expectations gave USD the marginal edge on the pair. The initial dollar dip on the softer core monthly reading was broadly consistent with a brief correction toward the identified Fibonacci zone before price recovered through the session — at the close, USD had gained approximately 0.17% against CHF.
It’s worth noting that USD/CHF had already pushed toward intraweek highs near R1 ahead of the data, meaning the original entry levels had shifted and traders would have needed to adapt to the new price picture. Thursday’s Trump peace announcement then triggered a broad-based dollar selloff, compressing the pair’s upside and requiring active management for anyone still holding a USD long into that session.
Those who entered the correction zone on Wednesday and targeted the 0.8000 major psychological level before Thursday’s bearish reversal would have been the most likely to see a net positive outcome. For those who held into Thursday’s diplomatic reversal without clearly defined exits, the outcome would have depended heavily on trade management and execution.
Promoted: Capitalize on the News Events Without Risking Your Own Funds.
In a major inflation report release, the corresponding currency can swing wildly intraday. Why risk your personal capital during extreme volatility?
Most proprietary firms terminate your evaluation account if you execute a trade during a major macroeconomic release, but FundedNext permits news trading across all models. Test 020your thesis with up to $300,000 in simulated capital, or take advantage of their Free Trial to experience the platform risk-free.
Explore FundedNext and Start Your Free Trial!
Disclosure: We may earn a commission from our partners if you sign up through our links.
Not Eligible to Move Beyond Watchlist – AUD/USD & Bearish USD Setups
AUD/USD: Bullish USD Event Outcome + Risk-Off Scenario
AUD/USD 1-hour Forex Chart Faster with TradingView
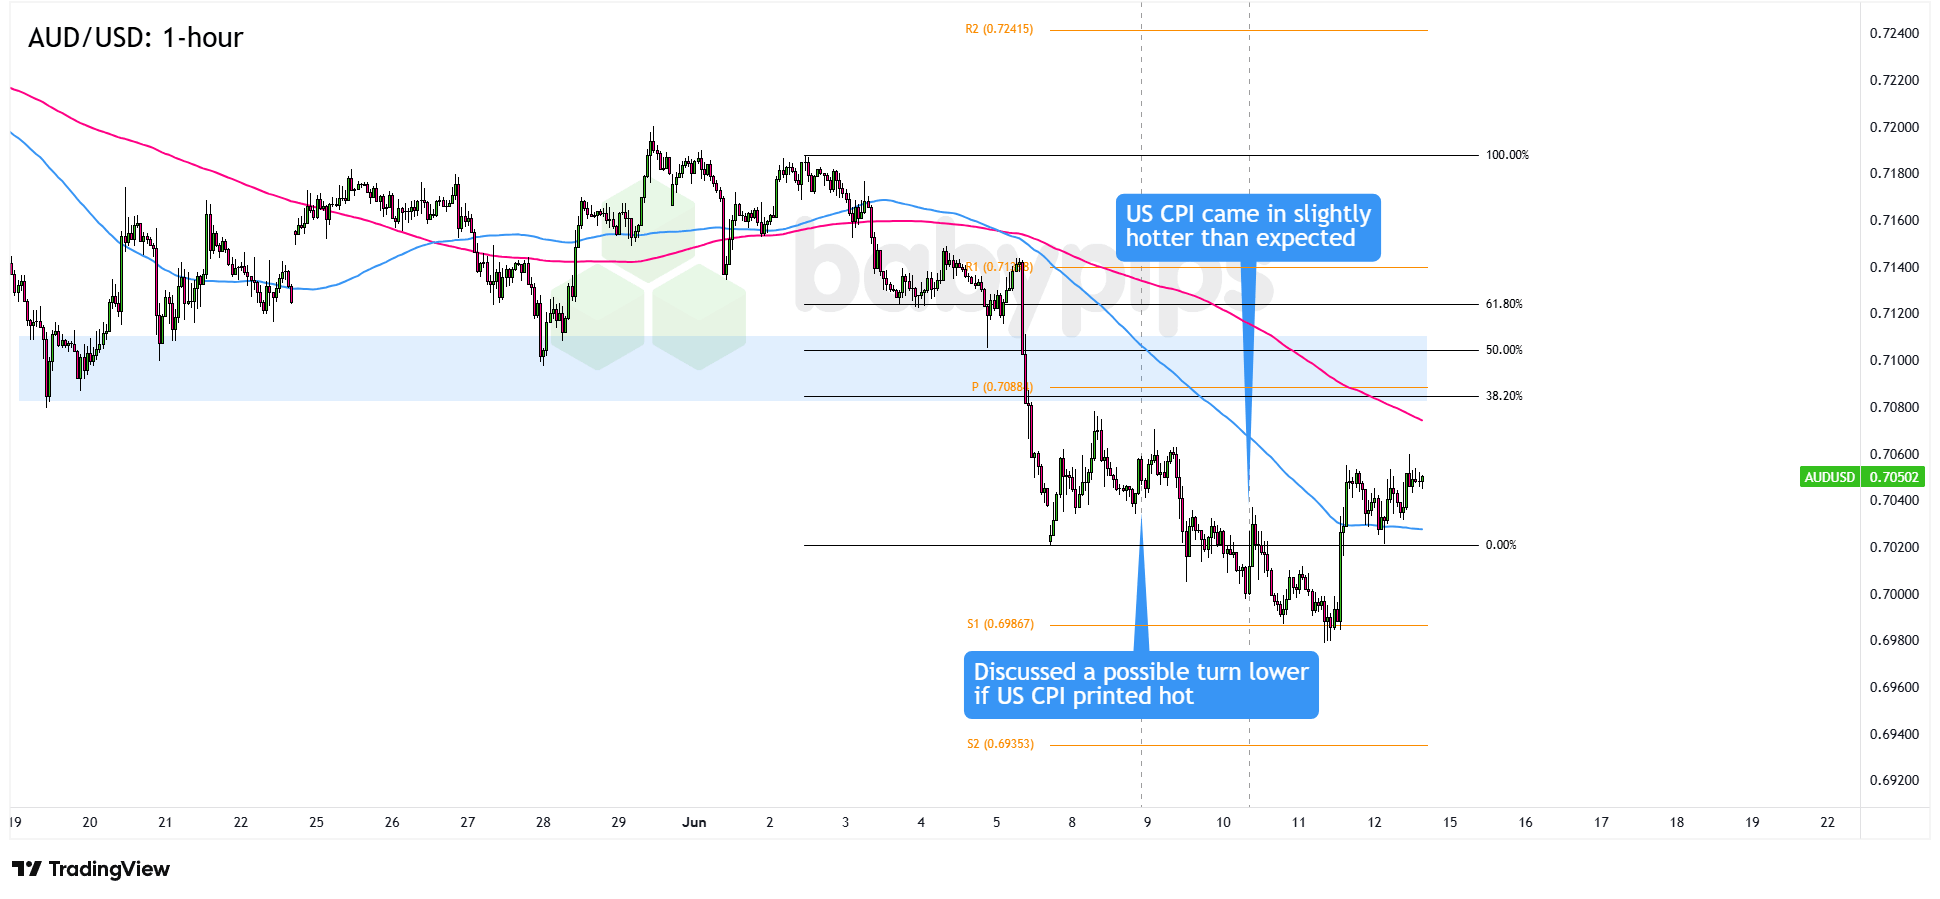
The AUD/USD watchlist set up a potential continuation of the pair’s slide below the .7100 psychological level in the event of hot CPI sustained a risk-off, hawkish-Fed environment. Any corrective bounce was expected to stall at the 38.2% Fib aligned with the pivot point (.7090) as a ceiling, and downside continuation targeting S1 near .6990.
The hot CPI condition was met, and Wednesday’s price action was broadly aligned — USD posted its sharpest session gains against AUD and NZD, consistent with the risk-off, higher-for-longer scenario the watchlist outlined.
The required environment, however, was a persistently risk-off setting, and Thursday’s Trump peace announcement triggered a sharp risk-on repricing in which commodity-linked currencies including the AUD were among the primary beneficiaries.
The reversal undermined the sustained directional move the original setup needed, so AUD/USD was not eligible to move beyond the watchlist stage on the original terms.
That said, the setup was directionally correct on CPI day itself. Traders who engaged Wednesday’s aligned window and managed risk carefully — taking profits near the .7025 swing low or setting stops near the .7090 ceiling ahead of Thursday — could plausibly have extracted value from the narrow opportunity. The premise was sound; the complication was the geopolitical pivot, not the data.
EUR/USD: Bearish USD Event Outcome + Risk-On Scenario
EUR/USD 1-hour Forex Chart Faster with TradingView
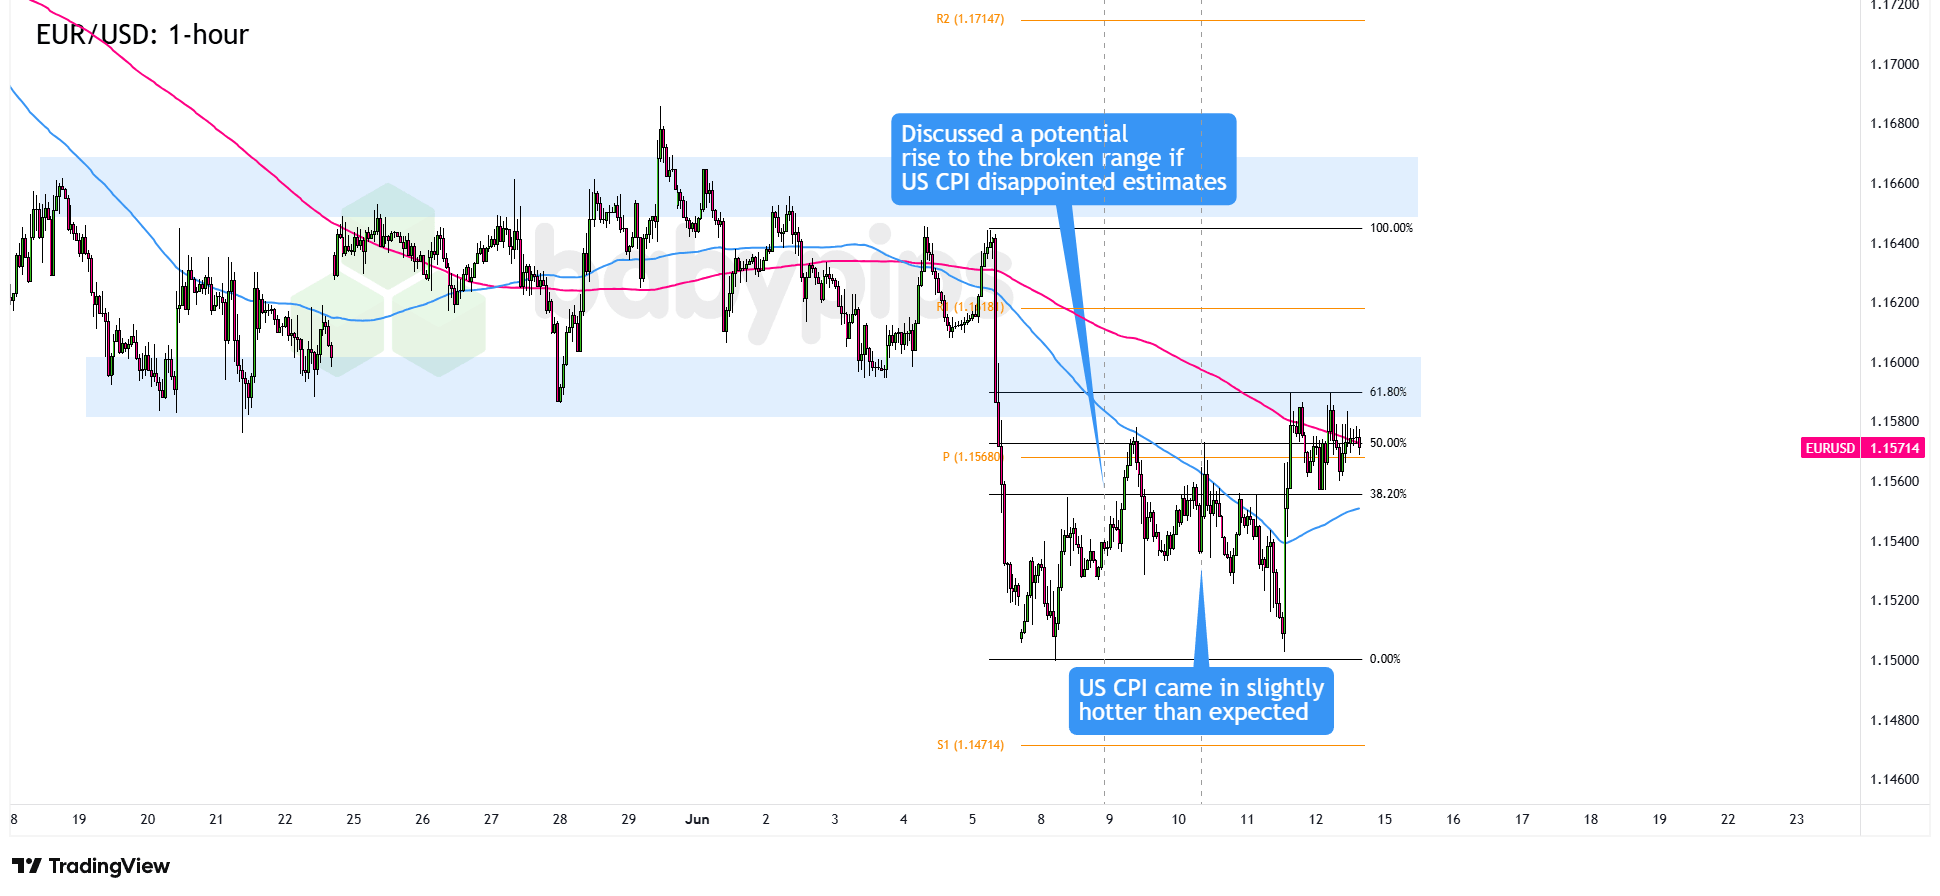
The EUR/USD watchlist was framed around a “buy the rumor, sell the news” scenario for the dollar, where a CPI print in line with or below consensus could allow EUR/USD to recover toward the broken 1.1580 range support, aligning with the 61.8% Fibonacci retracement and the 100 SMA on the 1-hour chart — with the ECB meeting flagged as a potential secondary catalyst toward the former 1.1660 resistance.
The headline CPI reading of 4.2% y/y directly invalidated this thesis: the above-consensus print reinforced rather than deflated hawkish Fed positioning, EUR/USD extended its slide through Wednesday’s session rather than recovering toward the target zone, and the ECB’s 25bps hike landed fully in line with expectations, providing no additional euro catalyst. For these reasons, EUR/USD did not qualify to move beyond the watchlist stage.
Thursday’s Trump peace announcement drove EUR/USD closer to the 1.1580 area identified in the original watchlist, but the move was driven entirely by geopolitical de-escalation rather than the cool CPI print the setup required.
Traders who recognized the different driver and adapted their approach on Thursday had a legitimate case for EUR/USD recovery, though that required reading the diplomatic pivot independently rather than executing the original watchlist conditions.
XAU/USD: Bearish USD Event Outcome + Risk-Off Scenario
XAU/USD 1-hour Forex Chart Faster with TradingView
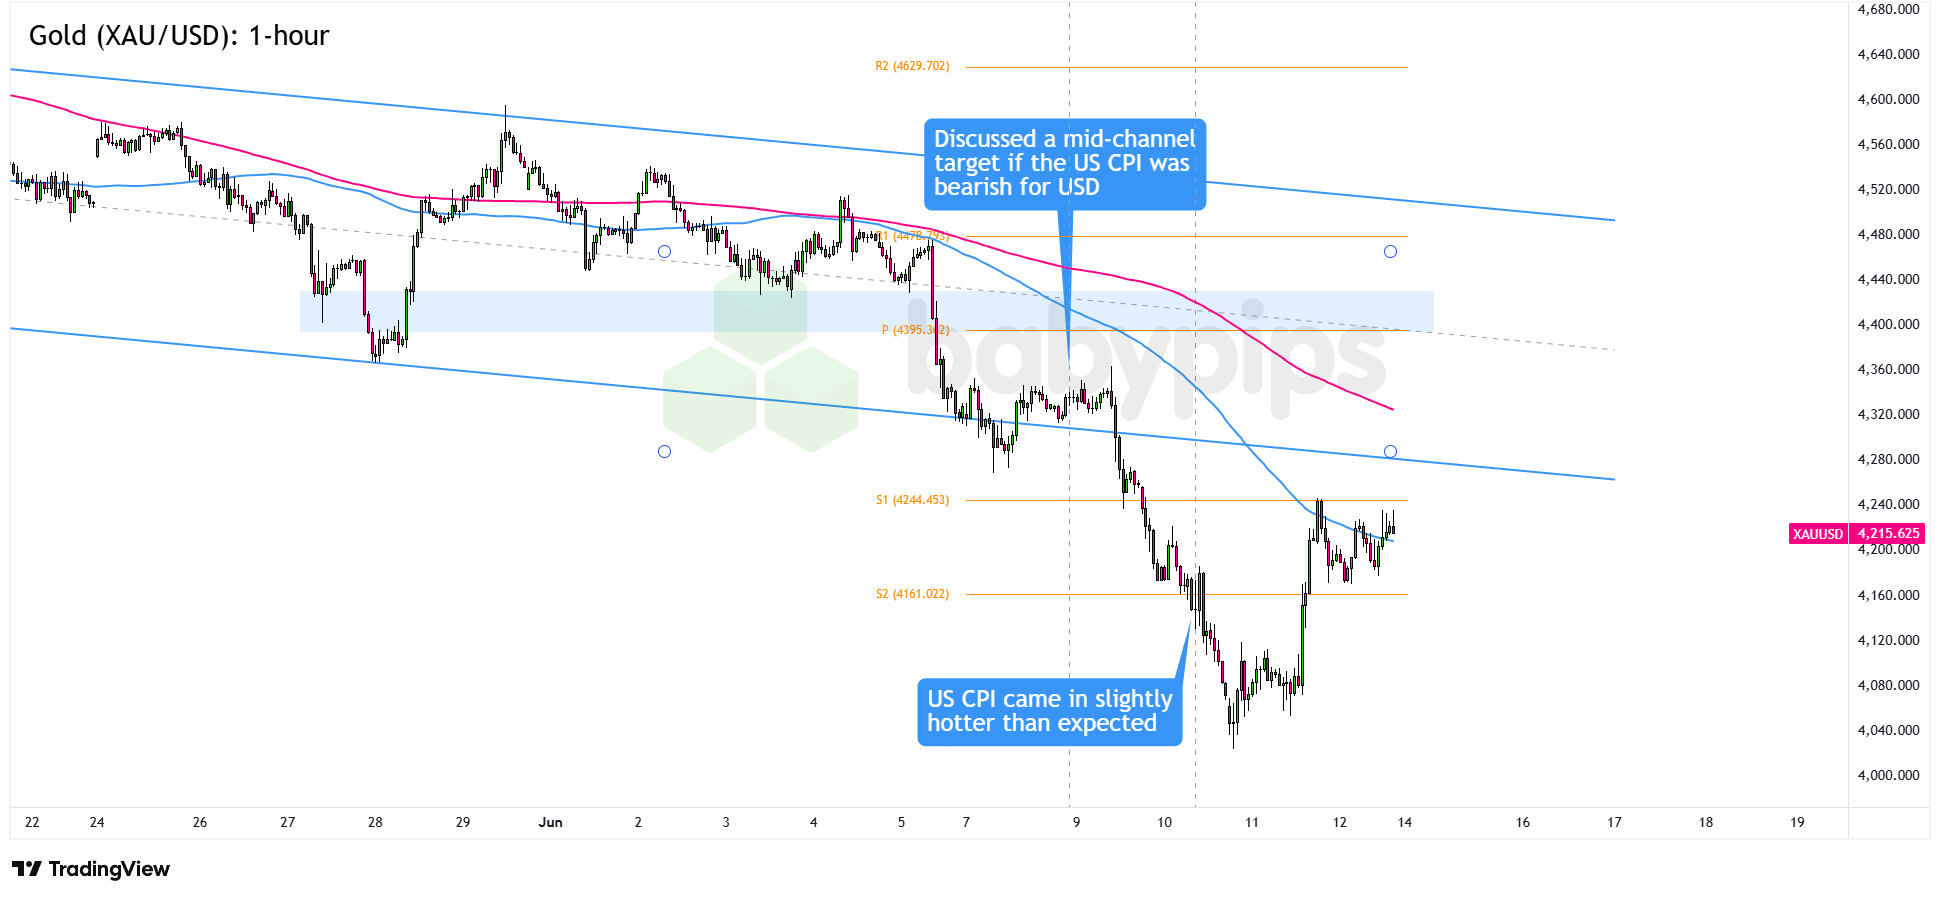
The XAU/USD watchlist was constructed as a risk-off, anti-USD play, with spot gold seen recovering toward the $4,400 mid-channel area where the 100 and 200 SMAs converged in the event of a cooler CPI print in a risk-averse environment, with stronger momentum flagged as capable of reaching $4,480 near R1 and the $4,500 psychological level near the top of the descending channel.
The outcome on CPI day directly invalidated the setup. XAU/USD plunged approximately 4% to near $4,080 despite an escalating geopolitical backdrop that would ordinarily be expected to support gold.
The above-consensus headline CPI reinforced real yield expectations and reduced the attractiveness of the non-yielding metal, while position liquidation from historically elevated levels amplified the decline. XAU/USD did not qualify to move beyond the watchlist stage.
Thursday brought a partial recovery of approximately 3.82%, bringing gold near $4,211 on the broad-based dollar selloff following Trump’s peace announcement, persistent core PPI elevation, and residual skepticism about deal finality.
While this brought XAU/USD back toward the watchlist’s broader price zone, the $4,400 target remained above Thursday’s close and the recovery operated on fundamentally different drivers than the original setup.
Traders monitoring the pair on Thursday may have spotted short-term opportunity in the de-escalation repricing, but any such approach required adapting entirely to the new market conditions rather than executing the original watchlist scenario.
The Verdict
The week’s watchlist produced a split result that highlights the challenge of trading around major macro events in a geopolitically complex environment. The target event triggered a mostly bullish USD reaction, and the USD/CHF setup offered arguably the cleaner alignment with the actual CPI outcome and risk backdrop.
The AUD/USD risk-off scenario also found directional support in Wednesday’s session, with the dollar posting its strongest gains against commodity-linked currencies, though sentiment quickly reversed the next day. Either way, both setups required active management on Thursday when Trump’s diplomatic pivot introduced a major exogenous headwind.
The EUR/USD and XAU/USD anti-USD setups were invalidated by the hot headline print, but both pairs ultimately moved partially in those setups’ intended directions the next day under a completely different market driver. These setups are best assessed as invalidated from a pure watchlist execution standpoint, though observant traders monitoring the pairs on Thursday may have identified short-term opportunities in the risk-on repricing.
Overall assessment: neutral to likely supportive of a net positive outcome, skewed toward a modestly positive outcome for the hot-CPI setups (USD/CHF and AUD/USD) on the day but with significant exogenous interference limiting the full expression of those setups’ potential by week’s end.
Both setups serve as a reminder that even well-constructed technical and fundamental frameworks can be overwhelmed when the data outcome and the exogenous environment align against the trade’s premise simultaneously.
Key Takeaways:
Energy-Driven Headline Inflation Doesn’t Always Produce Clean USD Trades
The May CPI headline beat was almost entirely driven by energy while core CPI actually undershot on a monthly basis. This distinction matters for USD traders, as markets may interpret an energy-driven headline beat with a degree of skepticism when it comes to sustaining dollar strength. The initial dollar dip on the in-line-to-softer core reading, followed by a recovery as the headline’s rate-path implications sank in, suggests markets were working through this distinction in real time.
Application: When headline CPI diverges significantly from core due to energy swings, consider that the initial market reaction may reflect confusion rather than a definitive verdict. The most durable USD moves on CPI day tend to track core trends, not headline beats driven by oil.
Geopolitical Pivots Can Override Data-Driven Setups Entirely
As in previous weeks, the most important lesson from this watchlist week may have nothing to do with the CPI itself. Trump’s Thursday announcement canceling strikes against Iran and signaling an imminent peace deal produced a synchronized market repricing that touched every major asset class simultaneously, and in some cases directly reversed what the CPI data had set in motion. The dollar selloff, equity surge, and oil crash on Thursday functioned as an independent macro shock that had nothing to do with inflation dynamics.
Application: In weeks when geopolitical risk is running high and actively evolving, any watchlist setup predicated purely on a scheduled data event should be planned with an explicit awareness that an exogenous development could invalidate or reverse the trade within hours. Position sizing and stop placement should account for the possibility of a geopolitical reversal, not just a data surprise.
The “Buy the Rumor, Sell the News” Dynamic Is Complex
When the headline print comes in above consensus, the “sell the news” argument can collapse because the data outcome itself delivers new information rather than confirming what was already priced. The brief USD dip on CPI day was consistent with the knee-jerk response to the softer core monthly reading, but it didn’t sustain.
Application: Before trading a “buy the rumor, sell the news” setup ahead of a major data release, have a clear framework for what data outcomes are needed to trigger the anticipated reflexive move. An in-line or below-consensus result is typically required. If the setup’s invalidation condition is a beat on the headline figure, size the position accordingly and have a clear stop pre-defined at a level that indicates the data has surprised to the upside rather than “disappointing” bullish positioning.
This article breaks down how the U.S. CPI beat moved the dollar through both hawkish Fed repricing and geopolitical headlines, and if you’re not sure why the same data print can produce very different market reactions depending on context, Premium members can read our lesson:
📖 From Data to Price Action: What Happens When Big News Hits
Reading this helps you understand the mechanics behind a post-data price spike, why the initial move is often the most dangerous time to trade, and how the secondary analytical move is where retail traders can find cleaner entries.
And if you’re not a Premium subscriber yet, now’s a good time to sign up.
With Babypips Premium, you get full access to School of Pipsology lessons that help you understand not just what the number was, but why the market moved the way it did and where the real trading opportunity begins after the dust settles.


