


The U.S. May ISM Services PMI printed well above expectations at 54.5, brushing aside forecasts for a softer 53.0 reading with broad-based gains in new orders, business activity, and prices paid that left little room for a dollar-bearish interpretation.
The beat came in during one of the week’s most risk-averse sessions, as Iranian missile strikes across Gulf military installations escalated Middle East tensions overnight — meaning the dollar’s gains came through two channels at once: a hawkish Federal Reserve repricing on the data, and simultaneous safe-haven demand driven by the geopolitical shock.
Let’s look at which setup from our watchlist ideas had a path to a clean trade.
Watchlists are price outlook & strategy discussions supported by both fundamental & technical analysis, a crucial step towards creating a high-quality discretionary trade idea before working on a risk & trade management plan.
If you’d like to follow our “Watchlist” picks right when they are published throughout the week, check out our BabyPips Premium subscribe page to learn more!
The Setup
What We Were Watching: U.S. ISM Services PMI (May 2026)
- Expectation: May ISM Services PMI to ease toward 53.0 from 53.6 prior; markets were positioned for continued moderation following April’s slight softening from the 54.0 level
- Data outcome: 54.5 vs. 53.0 forecast, from 53.6 prior
- Market environment surrounding the event: Net risk-off on Wednesday as Iranian ballistic missile strikes on Gulf military installations across Kuwait, Bahrain, Saudi Arabia, and Dubai escalated Middle East tensions overnight, snapping the S&P 500’s nine-session winning streak and driving WTI crude approximately 2.2% higher.
Event Outcome
The May ISM Services PMI cleared expectations comfortably at 54.5, marking its 23rd consecutive month in expansion and extending the string of resilient U.S. economic data that has kept hawkish Federal Reserve expectations well-supported through the quarter.
Business activity surged to 57.7 and new orders climbed to 57.3, both well above their respective 12-month averages. Prices paid jumped to 71.3, the highest reading since August 2022, while the employment component contracted for a third consecutive month at 47.9 — adding a stagflationary nuance to an otherwise hot report.
Key Takeaways:
- Business activity rose to 57.7, its second-highest reading since October 2024; new orders surged 3.8 points to 57.3, well above the 12-month average and pointing to sustained demand momentum in the services sector
- Prices paid jumped to 71.3, the highest reading since August 2022 and the 18th consecutive month above 60 — a persistent inflation signal that complicates any near-term rationale for Fed easing
- The employment component contracted for the third consecutive month at 47.9; the services sector is expanding and prices are running hot while businesses continue to reduce headcount, keeping the stagflation debate alive
- Factory orders for May rose 4.8% month-on-month, well above expectations, and the Federal Reserve Beige Book noted broadly stable employment alongside rising inflation driven by elevated energy costs, consistent with the broader theme of resilient but uneven U.S. economic momentum
- The ADP beat of 122k against a 75k consensus, the strongest private-sector reading since January 2025, amplified the hawkish repricing alongside the PMI result and reinforced expectations that May NFP due Friday could print above consensus
The U.S. dollar strengthened broadly following the data sweep, closing Wednesday as the best-performing major currency on a daily basis as traders repriced Fed policy expectations in response to the joint ADP and ISM beats. Treasury yields moved higher through the session and the DXY finished near 99.5, while gold and Bitcoin declined — consistent with a hawkish data repricing rather than a pure flight-to-safety trade.
Fundamental Bias Triggered: Bullish USD
Promotion: Top-tier catalysts like the U.S. Services PMI report can trigger emotional execution.
TradeZella AI powered journal turns your raw data into a high-performance playbook. Sync your broker, replay your trades bar-by-bar, and use the Playbook Designer to ensure that next time an economic data point surprises the market, you’re executing with clinical precision.
Click on the link to learn more and use code “PIPS20” to save 20% off first purchase!
Disclosure: We may earn a commission from our partners if you sign up through our links, at no extra cost to you.
Broad Market and Exogenous Drivers:
Geopolitical Flare-Up then Data Focus (Monday–Tuesday)
Geopolitical headlines and stronger U.S. data kept markets busy early in the week. Monday opened with Iran suspending nuclear talks in protest over Israeli strikes in Lebanon, triggering a sharp risk-off move at the U.S. open before equities clawed back part of their losses. Iran’s threat to fully close the Strait of Hormuz sent WTI crude nearly 5% higher to close near $90.90, but sentiment improved after President Trump announced an Israel-Hezbollah ceasefire and said Iranian negotiations were moving quickly.
Tuesday was quieter, with DXY barely higher on the day as traders prepped for key U.S. data points. A huge April JOLTS beat sparked upbeat NFP expectations and allowed dollar bulls to charge. Meanwhile, the S&P 500 crossed 7,600 for the first time on a fresh AI and semiconductor surge, keeping risk appetite cautiously constructive despite the geopolitical noise.
Gulf Missile Strikes and Data Double-Beat (Wednesday)
Wednesday brought another round of volatility after Iranian missile strikes extended to Kuwait, Bahrain, Saudi Arabia, and Dubai. The S&P 500’s nine-session winning streak snapped, while crude rose about 2.2% to $94.10. European services PMI readings improved from preliminary estimates across Germany, the Euro Area, and the U.K., but most stayed in contraction, so they did little to dent the dollar’s momentum.
The U.S. session delivered the bigger punch. ADP payrolls came in at 122K versus the 75K consensus, followed by an ISM Services PMI of 54.5 versus 53.0 expected. New orders and business activity were near cycle highs, while prices paid hit a 17-year high. Strong factory orders and a firm Beige Book added to the hawkish Fed reassessment, pushing Treasury yields and the dollar higher.
Ceasefire Optimism and the Pre-NFP Pause (Thursday–Friday)
By Thursday, the script flipped again. The Trump administration announced a second Israel-Lebanon ceasefire, while Trump said a U.S.-Iran deal could come together over the weekend. The House also passed a mostly symbolic war powers resolution to block further strikes on Iran. Those headlines eased near-term escalation fears, lifted equities, and knocked oil off its highs. The dollar underperformed as part of its geopolitical risk premium unwound ahead of Friday’s NFP report.
The highly-anticipated NFP release blew marked expectations out of the water with a 172K increase in hiring versus the 70K consensus, further stoking hawkish Fed expectations and dollar strength. USD emerged as the week’s top-performing currency, bolstered by lingering geopolitical uncertainty ahead of the weekend.
Scenario Scorecard: How Did They Play Out?
USD/JPY: Bullish USD Event Outcome + Risk-Off Scenario = Arguably good odds of a net positive outcome
USD/JPY 1-hour Forex Chart Faster with TradingView
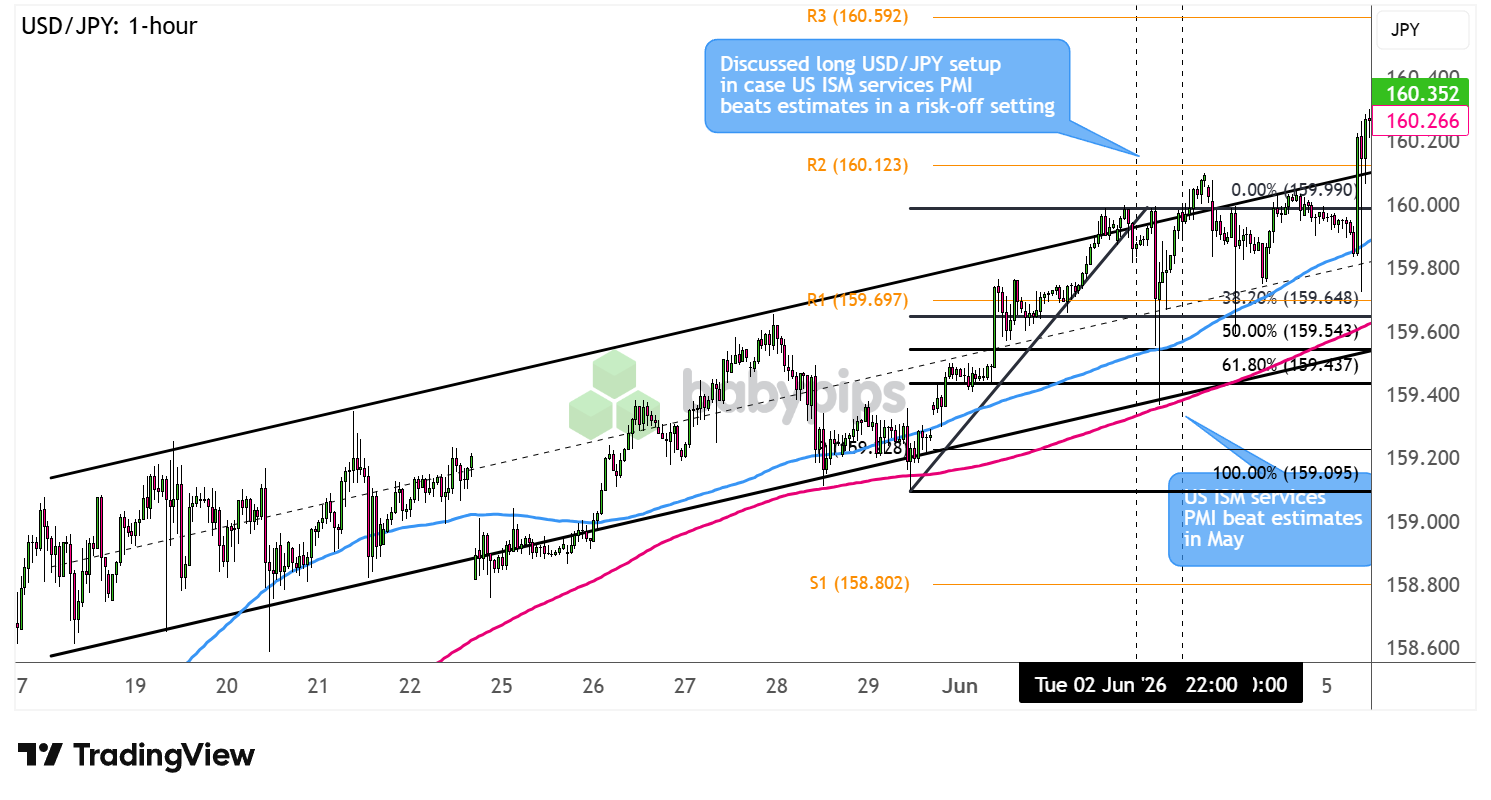
The watchlist identified USD/JPY as the risk-off play for this target event. Should the ISM Services PMI beat expectations, the pair’s ascending channel uptrend could hold, framing a potential Fibonacci correction to the 50% to 61.8% levels as entry on a quick dip and the 160.00 handle or channel top as target.
Because both conditions aligned on Wednesday — a substantial PMI beat alongside escalating Gulf hostilities that kept risk sentiment firmly defensive — this watchlist discussion on USD/JPY was arguably the setup best positioned to move beyond the watchlist stage.
USD/JPY pulled back from the R1 area into the targeted Fib zone in the sessions leading up to the event, with the pair trading near the 159.20–159.35 area a day before the release. The ADP beat released a few hours prior provided an initial leg higher, and the ISM Services PMI accelerated the move sharply toward R2 near 160.11.
The advance stalled there, however, as Finance Minister Katayama deployed a verbal intervention warning, restating Tokyo’s readiness to respond appropriately and introducing an effective ceiling at the 160.00 major psychological level that had already capped multiple advances in the previous weeks. Still, the blowout NFP report on Friday spurred another dollar leg higher that took the pair past this yen-tervention barrier.
Traders who entered on the pre-event pullback to the Fib zone and took profits near 159.90–160.00 were best positioned to see a net positive outcome from the discussion. For those who entered at or above post-data levels near 159.70, the trade management became the decisive variable.
Promoted: Capitalize on the News Events Without Risking Your Own Funds.
In a major central bank announcement, the corresponding currency can swing wildly intraday. Why risk your personal capital during extreme volatility?
Most proprietary firms terminate your evaluation account if you execute a trade during a major macroeconomic release, but FundedNext permits news trading across all models. Test 020your thesis with up to $300,000 in simulated capital, or take advantage of their Free Trial to experience the platform risk-free.
Explore FundedNext and Start Your Free Trial!
Disclosure: We may earn a commission from our partners if you sign up through our links.
Not Eligible to Move Beyond Watchlist – AUD/USD & Bearish USD Setups
AUD/USD: Bullish USD Event Outcome + Risk-On Scenario
AUD/USD 1-hour Forex Chart Faster with TradingView
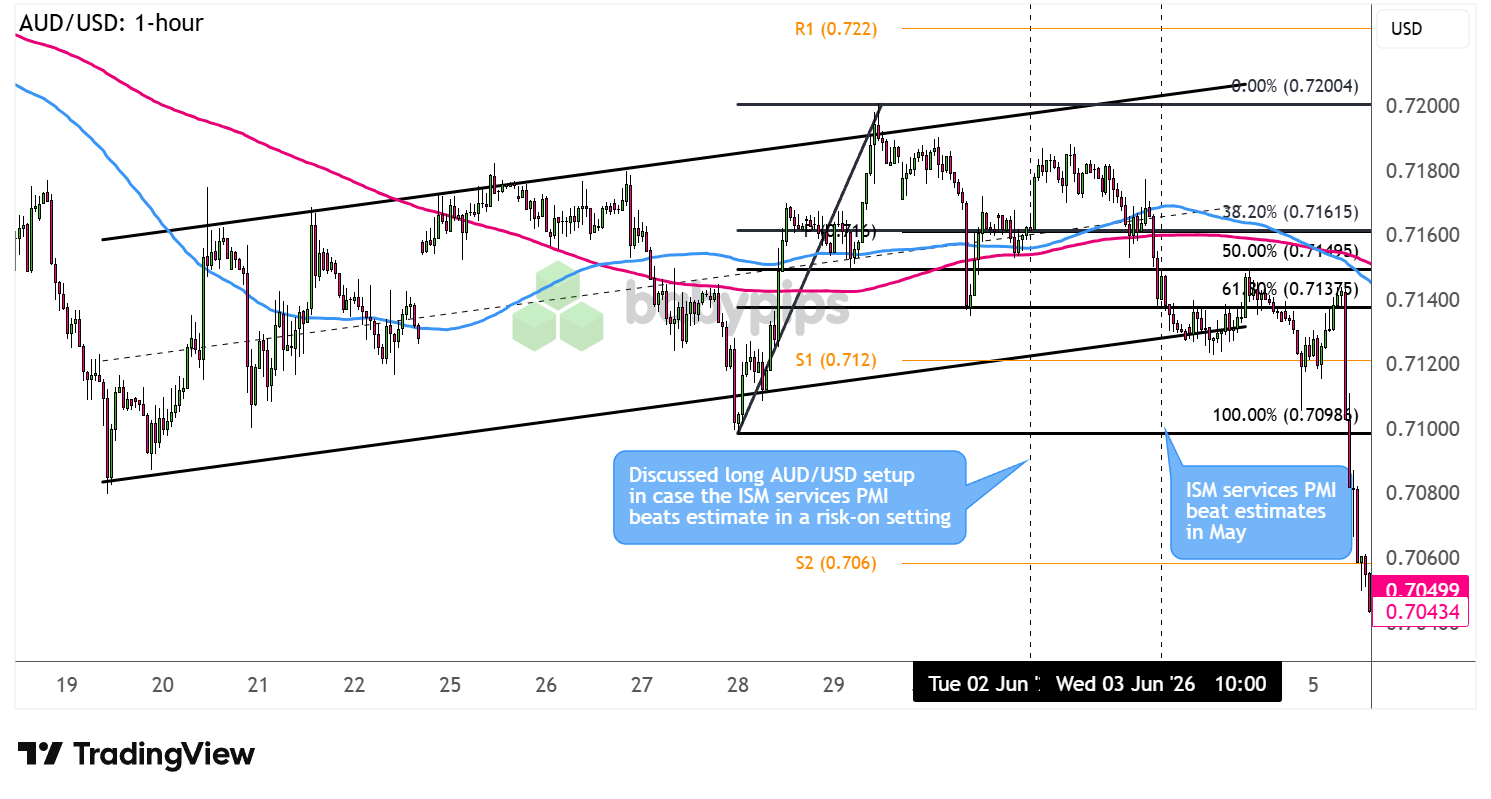
The AUD/USD watchlist looked for the pair to extend its ascending channel rally if the PMI beat in a risk-friendly environment, with the mid-channel area and 50% Fib near .7160 offering a potential entry and R1 at .7220 or the channel top near .7200 as targets.
In this scenario, there could be a case for resilient PMI easing recession fears and directing flows toward commodity currencies rather than the safe-haven dollar.
The upbeat PMI data condition was met since the 54.5 print was a substantial beat, but the risk environment was the opposite of what the setup required. Iranian missile strikes across Gulf military installations ensured Wednesday was unambiguously risk-off, and in that climate, the strong ADP and ISM data reinforced hawkish Fed repricing rather than commodity currency appetite.
AUD fell broadly on the session as dollar strength dominated, meaning the required setup did not flip the script to safe-haven unwinding, which left the AUD/USD idea ineligible to move beyond the watchlist stage.
Instead, AUD/USD moved against the direction the setup anticipated in the watchlist discussion, extending losses into the .7100 area as hawkish dollar expectations dominated the session. A partial recovery on Thursday driven by ceasefire optimism barely found legs, and the pair extended its slide post-NFP dollar domination was a strong theme on Friday.
NZD/USD: Bearish USD Event Outcome + Risk-On Scenario
NZD/USD 1-hour Forex Chart Faster with TradingView
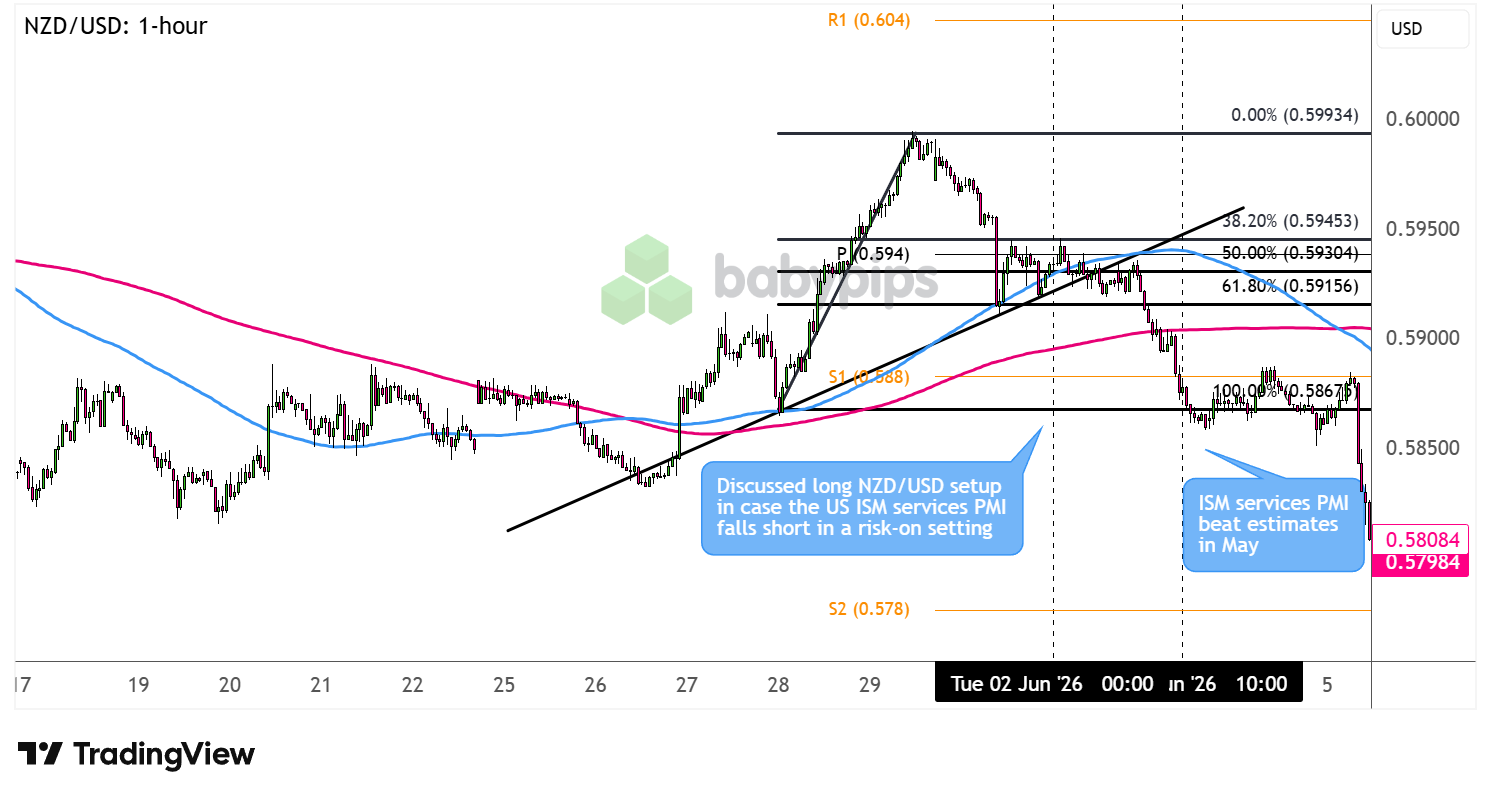
The NZD/USD watchlist idea looked for the pair to bounce from the 61.8% Fibonacci retracement zone near .5920 if the ISM Services PMI softened enough to revive dollar-bearish pressure in a risk-on setting, targeting a run toward the .6000 area or fresh swing highs.
The actual result negated the required scenario outright. The print came in at 54.5, which marked a substantial beat against the 53.0 forecast, delivering a bullish USD outcome rather than the soft print the setup needed.
With the ADP beat amplifying the hawkish repricing and the geopolitical risk-off backdrop reinforcing safe-haven dollar demand, neither fundamentals nor market sentiment aligned with the idea, rendering NZD/USD not eligible to move beyond the watchlist stage.
NZD/USD dropped well below the .5920 Fib zone framed as the watchlist entry, extending losses toward the .5870 area on Wednesday before a Thursday bounce on ceasefire optimism proved short-lived. The pair remained below the original watchlist levels through Friday’s close as the dollar rallied on an upside NFP surprise, and geopolitical uncertainty kept high-beta currencies on a bearish footing.
USD/CHF: Bearish USD Event Outcome + Risk-Off Scenario
USD/CHF 1-hour Forex Chart Faster with TradingView
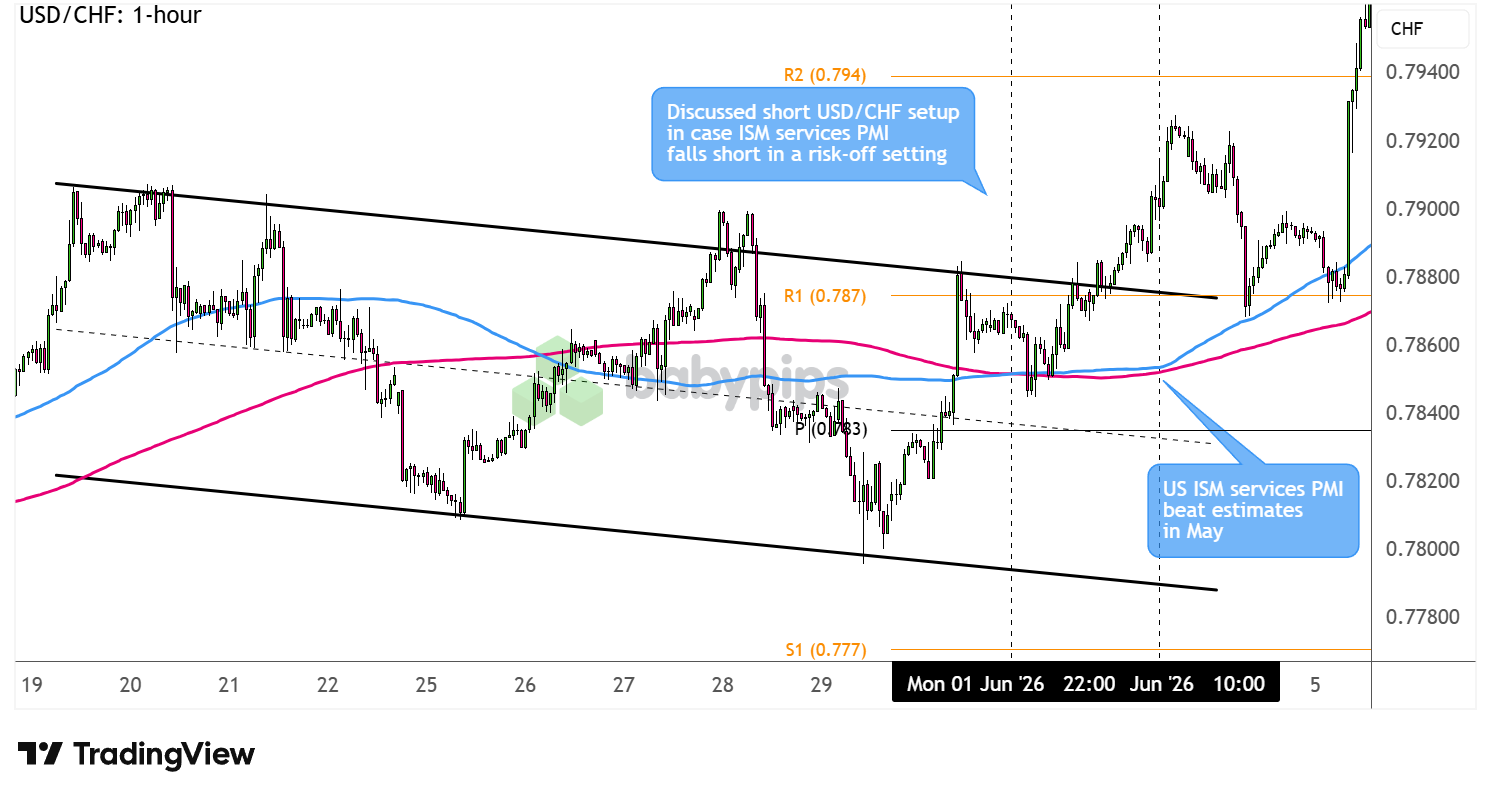
The USD/CHF watchlist identified a potential short from resistance near R1 at .7870 if the PMI underwhelmed in a risk-off setting, targeting a decline toward .7835–.7850 and a resumption of the pair’s longer-term downtrend.
Though risk-off flows were in play around the target event, the data outcome negated the setup. The ISM Services PMI’s 54.5 print, backed by the ADP beat and above-forecast factory orders, left no room for the dollar-bearish outcome the watchlist required.
USD/CHF surged past the channel top, and .7900 major psychological resistance as the dollar strengthened broadly rather than breaking down, leaving the original setup not eligible to move beyond the watchlist stage.
While the pair still saw some bearish action after the ISM services PMI release, it’s worth pointing out that this selloff was mostly a result of a brief risk rally on Israel-Lebanon ceasefire optimism and upbeat Swiss data — factors that were not really part of the watchlist thesis. This move merely offered a retest opportunity to catch the move in the opposite direction, especially as souring risk sentiment and stronger Fed rate hike expectations from the NFP surprise extended the USD/CHF rally until the end of the week.
The Verdict
USD/JPY moved broadly in line with the risk-off PMI beat scenario, rallying from the Fibonacci correction zone toward the 160.00 intervention threshold following Wednesday’s data cluster.
The ISM Services PMI printed at 54.5, with new orders and prices paid at near-cycle highs reinforcing the case for a more extended Fed tightening cycle. Escalating US-Iran hostilities ensured the backdrop was unambiguously risk-off, channeling safe-haven flows into the dollar alongside the hawkish repricing and amplifying the move beyond what the data print alone would have produced.
Keep in mind, however, that Japan’s 160.00 level has become an effective ceiling through repeated intervention cycles, and Finance Minister Katayama’s verbal warning on Wednesday was consistent with prior episodes. The ceiling compressed the reward window and ensured that Thursday’s partial reversal on ceasefire optimism tested any positions that did not scale out near the top.
Overall, we’d rate this USD/JPY discussion as likely supportive of a net positive outcome, with the intervention ceiling compressing the reward window for post-event entries and converting the trade into a management-dependent play for the remainder of the week.
Traders who entered on the pre-event pullback to the Fib zone and managed toward 159.90–160.00 likely captured the setup’s core move cleanly, while those entering at or after the print faced the intervention ceiling almost immediately and required disciplined trade management to navigate Thursday’s reversal before Friday’s partial recovery to 159.93.
Key Takeaways:
A Risk Off Data Beat Pushes the Dollar Through Two Channels at Once
When strong U.S. data hits during a geopolitical risk-off episode, the dollar can get support from two sides: hawkish Fed repricing and safe-haven demand. The ISM Services PMI beat tightened Fed expectations, while Iranian missile escalation pushed defensive flows into Treasuries and the Greenback.
That combination made the dollar’s move sharper and stickier than either driver likely would have managed alone. It also showed how geopolitics can amplify or limit the dollar’s reaction to data, depending on whether both channels are pulling in the same direction.
Intervention Thresholds Can Cap an Otherwise Clean Setup
A setup can line up well on the fundamentals and the market backdrop, then still run into a ceiling set by government price management. USD/JPY had support from strong U.S. data and risk off flows, but Japan’s 160.00 intervention threshold limited the pair’s reward window just as the catalyst pushed price into major resistance.
When a target sits near a government-watched currency level, scaling out near that zone is usually the cleaner move than holding out for extra extension.
This article breaks down how the ISM Services PMI beat moved the dollar through both hawkish Fed repricing and safe-haven demand, and if you’re not sure why the same data print can produce very different market reactions depending on context, Premium members can read our lesson:
📖 From Data to Price Action: What Happens When Big News Hits
Reading this helps you understand the mechanics behind a post-data price spike, why the initial move is often the most dangerous time to trade, and how the secondary analytical move is where retail traders can find cleaner entries.
And if you’re not a Premium subscriber yet, now’s a good time to sign up.
With Babypips Premium, you get full access to School of Pipsology lessons that help you understand not just what the number was, but why the market moved the way it did and where the real trading opportunity begins after the dust settles.


