


If you trade XAG/USD, silver CFDs, silver futures, or silver ETFs, here’s a deeper dive into what moved silver this week and what to watch going into next week.
Silver dropped nearly 10% at its worst and came all the way back. Weekly close: $68.01. Weekly change: +0.35%.
The Week in Review
The week had five acts. Two of them were good.
Monday: NFP Hangover, Silver Holds
The prior Friday’s jobs report had set the tone. May payrolls blew past consensus. Rate hike odds jumped.
The week opened with that pressure already in the air.
Tuesday: The First Selling Wave
US airstrikes on Iran began, targeting military assets in retaliation for the downing of an American Apache helicopter near the Strait of Hormuz. In most wars, that kind of escalation lifts silver. This war works differently.
Escalating conflict → higher oil → persistent inflation → Fed stays hawkish → silver falls.
That chain ran again on Tuesday. Silver closed at $65.35. Down 4.1% from Monday.
Wednesday: CPI Plus Overnight Strikes
May CPI printed hot, driven almost entirely by energy costs tied to the Strait of Hormuz disruption. Core CPI came in below forecast, but markets traded the headline.
Hot inflation → Fed stays hawkish → silver falls.
Silver closed at $63.40, down another 3.0%.
Overnight, the US launched additional airstrikes against Iran.
Thursday: The Worst Open. Then the Bounce.
Silver opened Thursday at its lowest level since December 2025, with the intraday low hitting $61.50.
Three more bearish catalysts hit during the session: hot PPI, an ECB rate hike for the first time since September 2023, and a second night of US airstrikes on Iran.
Any one of those should have pushed silver lower. But silver closed up 6.2%.
Friday: Peace Optimism Holds the Gains
Trump said a US-Iran deal could come “as early as this weekend.”
Silver held Thursday’s gains and closed at $68.01.
The week ended flat.
The Gold/Silver Ratio
The gold/silver ratio measures how many ounces of silver it takes to buy one ounce of gold. The ratio started the week at 63.5 and closed Friday at 62.0.
Silver held its ground better than gold through the week’s swings.
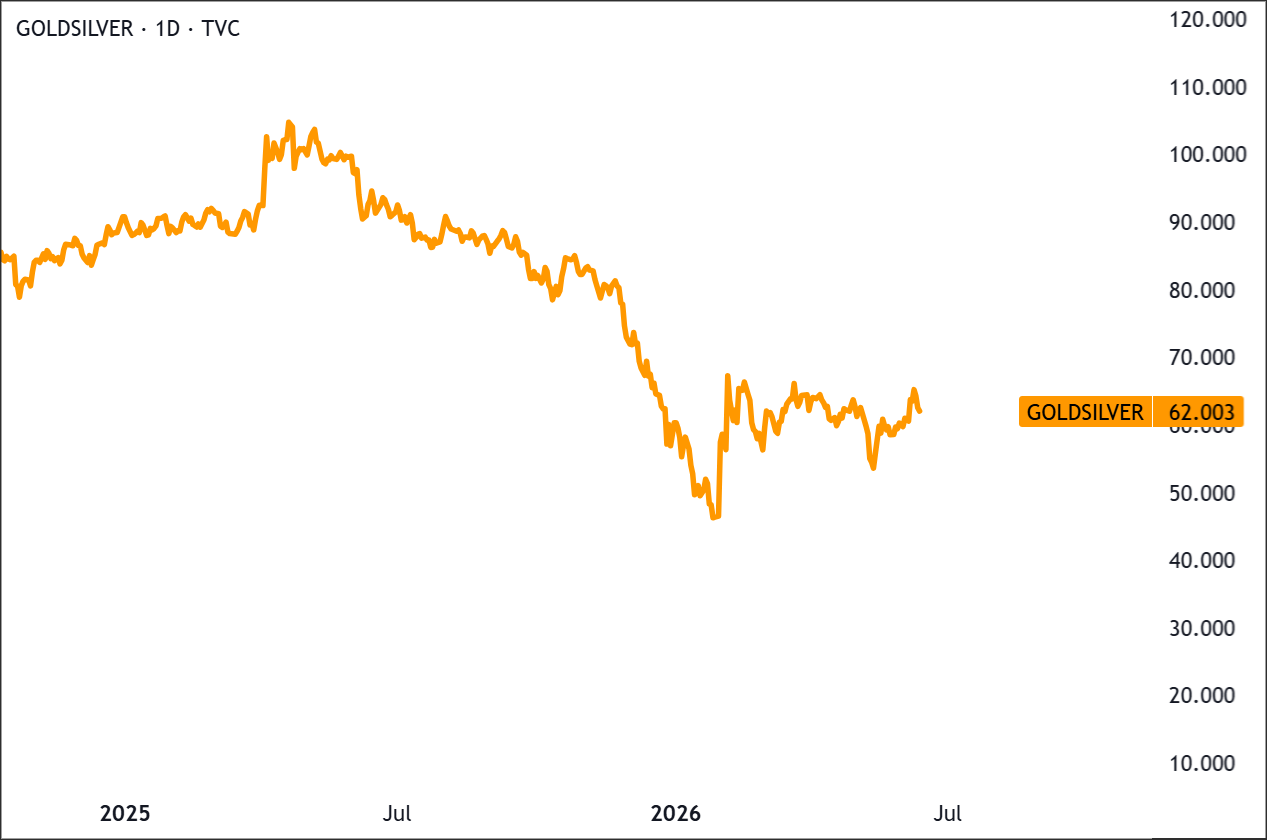
Both metals respond to the same monetary forces: real rates, the dollar, rate expectations.
Silver moves more in both directions because it trades in a thinner, more speculative market than gold and carries real industrial demand from solar, EVs, and electronics that ties it to economic cycles in a way gold doesn’t.
When rate fears spike, silver tends to fall harder. When they ease, it tends to bounce harder.
Managed Money Positioning
Managed money refers to large hedge funds and institutional traders who bet on silver futures. As of June 9, net long positioning stood at 10,403 contracts. That’s a light position, not crowded on either side.
No extreme that would amplify the next move.
Technical Backdrop
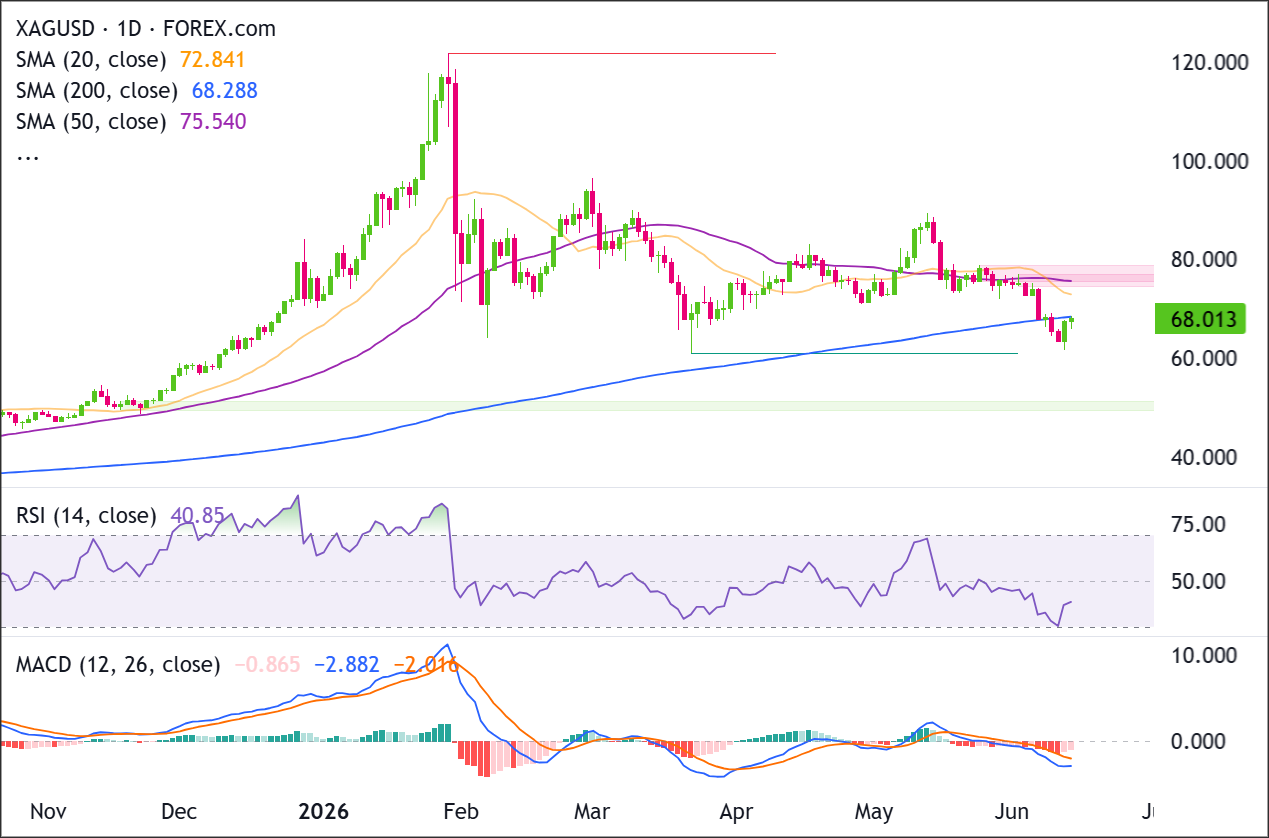
Recent price action shows a sharp selloff into the 64.00-65.00 area, followed by a modest bounce back toward 68.00.
Buyers are trying to stabilize price near the 200-day SMA, but momentum remains weak while price trades below 72.841 and 75.540.
Sellers need a daily close below 64.00 to confirm another leg lower toward 60.00.
Moving Averages
The 20 SMA is at $72.84 and the 50 SMA is at $75.54. Both sit well above price and both are declining.
Two short-term averages stacked overhead and falling. That’s not a bullish near-term picture.
The 200 SMA sits at $68.29. Silver closed at $68.01, just $0.28 below it.
Closing below the 200 SMA is significant. If price can’t reclaim it quickly, the level flips from support to resistance, and the next area of support is the $61.50 intraday low from Thursday.
Momentum
RSI is at 40.85. Below neutral, but not yet oversold. Room to fall further before the indicator signals selling exhaustion.
Both MACD lines are well below zero, reflecting sustained selling pressure. But the histogram was narrowing this week, a sign that selling momentum is starting to fade.
Key Support & Resistance Levels
Price closed just below the most important level on the chart.
| Level Type | Price Zone | Technical Significance |
|---|---|---|
| Major Resistance | $80 to $82 | Prior failed recovery ceiling after the February crash |
| Secondary Resistance | $72 to $75 | 20 SMA at $72.84 and 50 SMA at $75.54 stacked overhead |
| Immediate Resistance | $68.29 | 200 SMA; price closed below it this week, now the first level to reclaim |
| Immediate Support | $65 to $67 | This week’s post-bounce consolidation zone |
| Major Support | $61.50 | This week’s intraday low; where buyers returned in force |
| Psychological Support | $60.00 | Round number support below this week’s low |
Current Market Conditions at a Glance
Everything we just covered, in one place.
| Indicator | Reading | What It’s Telling You |
|---|---|---|
| XAG/USD Close | ~$68.01 | Up 0.35% on the week. A flat number hiding a nearly 10% intraday crash and a full recovery. |
| Distance from ATH ($121.67) | ~44.1% below | Deep in correction territory. January’s blow-off top is still doing damage. |
| 200 SMA | $68.29 | Price closed $0.28 below it. The structural floor did not hold on a closing basis. Whether price can reclaim it next week is the key question. |
| 50 SMA | $75.54 | Well above price and declining. A potential ceiling on near-term recovery, not an immediate concern. |
| RSI (14-day) | 40.85 | Below neutral and drifting lower. Room to fall before a real flush signal appears. |
| MACD | Bearish, histogram narrowing | Line (-2.882) below signal (-2.016). Histogram -0.865 but narrowing. Selling momentum is starting to fade. |
| Gold/Silver Ratio | ~62.0 | Compressed from 63.9 Wednesday as silver outperformed gold in the bounce. Silver measurably cheaper relative to gold than earlier this year. |
| Managed Money Positioning | Net long 10,403 contracts (June 9) | Light. Not crowded. This week’s selling was macro-driven, not a spec unwind. Lower cascade risk heading into FOMC. |
| Brent Crude | ~$86.88/bbl | Down 7.7% on the week. Iran peace optimism pulled oil lower. Still elevated enough to keep the inflation narrative alive. |
| Fed Rate Expectations | 97% hold at June 16-17 FOMC | Markets expect no rate change. The dot plot and Warsh’s press conference are where all the risk lives. |
| Next Key Event | Iran deal Sunday, FOMC June 16-17 | A Sunday signing changes the setup before markets open Monday. The FOMC follows Wednesday. Both carry significant risk for silver. |
The Big Thing to Watch
Two events could move silver next week.
The Iran Deal
The US and Pakistan announced a signing scheduled for Sunday. Iran denied the signing would happen that soon, which keeps the outcome uncertain.
If it holds, the Strait of Hormuz reopens, which would ease oil prices and likely push silver higher at the Monday open. Watch Sunday closely.
The FOMC
The FOMC follows on June 16-17. Kevin Warsh chairs his first meeting as Fed Chair. Markets price a 97% probability of no rate change. But that’s not the story.
The story is what Warsh signals through the dot plot and his press conference. Warsh has expressed skepticism about the dot plot, so it may not even be released. Either way, his press conference tone is the main event.
A hawkish press conference tone could push December rate hike odds higher and keep pressure on silver. A dovish tone with no hike signals could give silver room to breathe.
If you’re not familiar with what “hawkish” and “dovish” actually mean in a Fed context, or why a press conference can move markets more than the rate decision itself, Premium members can read our lesson:
📖 Hawkish vs. Dovish: How to Read Central Bank Language
Reading this helps you understand what hawkish and dovish signals actually look like, how to decode central bank language beyond the rate decision, and why Warsh’s press conference tone is the real market-moving event here.
And if you’re not a Premium subscriber yet, now’s a good time to sign up.
With Babypips Premium, you get full access to School of Pipsology lessons that help you understand not just what the FOMC decided, but the language central banks use to signal where policy is heading next.
Key Levels to Watch
If you’re looking to go long, wait for a confirmed close above the 200 SMA and follow-through. Price is sitting just below it after this week’s test. Buying below it without confirmation is fighting the technical setup.
A dovish FOMC or a confirmed Iran peace deal would create that opportunity.
If you’re already long, the 200 SMA is your line. A hold above it on follow-through sessions improves the picture. A rejection, where price pushes up to the level and reverses below it, confirms it as overhead resistance.
A hawkish FOMC outcome is the clearest threat to this position.
If you’re looking to go short, a break below $61.50 that holds is the setup. This week proved price can reach it quickly. A hawkish dot plot is the most likely catalyst.
A Sunday Iran deal signing could push silver higher at the Monday open. See how Monday opens before sizing into any short.
If you’re already short, watch the 200 SMA. A close above it invalidates the short thesis. A dovish Warsh press conference or a confirmed Iran deal headline could force you to close the position in a hurry.
The FOMC decision drops on Wednesday. Warsh’s press conference could move silver sharply in either direction. Size positions accordingly.


